Tag Archives: investing ideas

IGR Vs. AWP: What’s A Yield Worth?

CBRE Clarion Global Real Estate Income Fund and Alpine Global Premier Properties Fund both provide access to global real estate. However a comparison between the two brings up an interesting distinction on the distribution front. Do you want yield at the expense of NAV growth or yield and NAV growth? I was recently asked to take a look at the CBRE Clarion Global Real Estate Income Fund (NYSE: IGR ). IGR is a CEF that focuses, as its name implies, on real estate across the globe. This, inevitably brings with it a comparison to a fund like the Alpine Global Premier Properties Fund (NYSE: AWP ). At the core, they both do similar things and could, arguably, be interchangeable. However, income seekers might be drawn to AWP’s nearly 9% yield over IGR’s lower 6.5% yield. And why not, since they do about the same thing? A lot alike In fact, both have similar discounts right now, with each floating around a mid-teens discount to net asset value. So either one would be cheap. Performance is a bit of mixed bag, however, with IGR outdistancing AWP over the trailing five years through May on an NAV total return basis, which includes reinvested dividends. But AWP beating IGR over the trailing three years. More recently, AWP has handily outperformed, posting a year to date gain of nearly 7% versus a 1.5% decline at IGR’s (both including distributions). Looking at standard deviation, a measure of price volatility, IGR was less volatile over the trailing five years and roughly equally volatile over the trailing three years. So it’s hard to make much of a distinction on this point between the two. That said, both make use of leverage , but they have each kept that to a relatively low level recently at around 6% of assets. Cost wise, IGR has a slight edge . It’s expense ratio is roughly around 1.15%. AWP’s expense ratio is a little higher at around 1.3% or so. Neither, however, is so high that they stand out. So here are two funds with roughly similar objectives. Both are trading at steep discounts. But AWP has a notably higher yield and has been performing better of late. The easy answer is buy AWP. That said, you wouldn’t be buying a bad fund if you chose IGR. Pick your poison? Things aren’t that simple, however. And a quick look at the distributions helps explain why. Since it’s IPO in 2004 , IGR has paid investors over $13 worth of distributions. The IPO NAV of the CEF was $14.10. True, the shares currently trade below that level, with an NAV of close to $9.50, but for income investors the benefit has been fairly large despite the NAV decline. Alpine, meanwhile, started life in 2007 with an NAV of around $19 a share. It’s net asset value is roughly $7.50 a share more recently. It’s distributions over that span have been around $6.50 a share. I’m rounding in both cases, but the point should be pretty clear. But just for fun, if you add the current NAV to the total distributions received for both funds you get around $23 for IGR and nearly $16 for AWP. Since IGR had an NAV at IPO of around $14 and AWP’s NAV at IPO was a touch over $19, which one has been the better option? Since 2007 was a pretty awful time to open a fund that may not be a completely fair comparison. But the same trend holds true over shorter periods, too. Let’s look since 2010 instead (using fiscal years for AWP). Over that span, AWP’s NAV has gone from roughly $7.25 a share in October of 2009 (the end of its fiscal year) to $7.50 a share. It’s paid out around $3.75 in distributions. IGR, meanwhile, has seen its NAV go from about $7.50 at the start of 2010 (it’s fiscal year ends in December) to about $9.50. Meanwhile it’s paid out about $2.90 a share in distributions. If all you are looking for is income, yes, AWP paid out more in distributions. But at the cost of NAV growth, since the NAV rose only about 3% over the span. With IGR, there was less income, but your principal grew by around 25%. In other words, if you buy AWP, your return is almost all in the distribution. That’s fine during good times, but when there’s a bad market it makes building back the NAV that much harder to achieve and can result in distribution cuts if the downturn is long enough. Your call, but I like conservative At the end of the day, which option is better for you really depends on your situation and temperament. If you only care about income, AWP is the clear winner. For me, I’d prefer a fund with a lower yield and net asset value growth. So, there’s reasons to like AWP over IGR, but I’d go with the more conservative distribution if I were making the choice. Disclosure: I/we have no positions in any stocks mentioned, and no plans to initiate any positions within the next 72 hours. (More…) I wrote this article myself, and it expresses my own opinions. I am not receiving compensation for it (other than from Seeking Alpha). I have no business relationship with any company whose stock is mentioned in this article.
The Labor Market Could Bring Down GLD

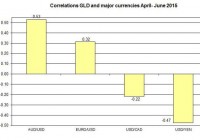
Summary The Greek drama keeps moving the markets and the price of GLD also reacts mainly via the movements in the foreign exchange markets. The price of GLD is likely to keep reacting to the progress of the U.S. economy. The non-farm payroll report could move again the price of GLD and raise the odds of a rate hike in September. The Greek drama continues to lead the news cycle and keeps to move the euro against major currencies including the U.S. dollar. The strengthening of the U.S. dollar against the euro could have an adverse impact on the price of the SPDR Gold Trust ETF (NYSEARCA: GLD ). Besides the ongoing bets of whether Greece exits the Eurozone, this week we also have the release of the non-farm payroll report. This report is likely to keep moving the gold market in general and GLD, as the markets try to figure whether the current economic conditions are good enough for the Federal Reserve to raise rates in September. The decision of Alexis Tsipras to call for a referendum is understandable given the high stakes involved, but should have been made a while back, and not so close to the IMF’s payment deadline. For now, the polls suggest the Greeks are likely to accept this deal. Because they are more frightened of what lies ahead with a Grexit over remaining in the Eurozone or in other words better the devil you know… Behind door number one, in the event of a Grexit, the Greeks could face very weak currency, high inflation, unstable, if at all, banking system for years to come. But door number two isn’t too appealing either: elevated unemployment, much higher taxes, lower pensions, and high debt payments for decades. At least under this status quo option, they keep having a strong currency and a working baking system. Who would want to make this lesser of two evils choice? When it comes to the potential impact of the news about a Greek exit or default on its debt on the euro, the situation isn’t straight forward. For one, investors and traders react to the uncertainty following a messy Greek exit with falling stock prices throughout Europe, Asia and U.S. and falling euro against leading currencies. But over the longer run, such a scenario should move the euro upward as part of the weakness of this currency relates to the high debt European countries including Greece. One fewer highly leveraged country in the EU should lead, down the line, to an appreciation of the euro. For GLD, even though higher uncertainty in the financial markets tends to play in favor of precious metals, the potential appreciation of the U.S. dollar against the euro could drag down the price of GLD. (click to enlarge) Source of data: Author’s calculations The other big news item for the week is the non-farm payroll report. This week, the report will be released on Thursday and could move the price of GLD as it has in the past. Last month, the employment report showed a 280,000 gain in number of jobs, which was higher than expected. This time, the market estimates a gain of 231,000 jobs. If the report were to show a higher increase in number of jobs, this could lead to another drop in the price of GLD. (click to enlarge) Source of data: U.S. Bureau of Labor Statistics and Google Finance Besides the short-term impact of the news of the progress of the U.S. labor market, this news could also raise the odds, which have gone down after the last FOMC meeting, of a rate hike in September. Another issue to keep tabs on is the changes in wages, which have gone up slowly in the past few months – the growth rate reached 2.3% last month. A higher growth rate could also raise the odds of a potential rate hike – it’s another closely monitored data point in the labor report, and so far this year, we have only seen a modest increase in wages. As of the beginning of this week, the implied probabilities for a rate hike in September have reached 14%; for the October meeting, the odds are 28%; and for December, the probabilities are only 50%. These odds still suggest the market isn’t convinced the FOMC plans to raise rates in September. The upcoming non-farm payroll report could have another short-term impact on the price of GLD and move the odds of the possible rate hike in the coming months. The minutes of the last FOMC meeting will be released next week, but aren’t likely to provide more guidance than the last FOMC meeting. So far, the Fed keeps using the same mantra – the decision to raise rates will be “data dependent” – and as such, we will have to continue to closely monitor the progress of the U.S. economy. For more, please see: ” Gold and Inflation – Is there is relation? ” Disclosure: I/we have no positions in any stocks mentioned, and no plans to initiate any positions within the next 72 hours. (More…) I wrote this article myself, and it expresses my own opinions. I am not receiving compensation for it (other than from Seeking Alpha). I have no business relationship with any company whose stock is mentioned in this article.

Can Investing With Activist Investors Produce Alpha?

Investing the day after an activist investor announces a large stake can produce alpha. The strategy over 34 activist stakes generated 18.12% per year, nearly 4% more than the S&P 500. We can replicate the process through 13F and 13D filings. The hedge fund industry’s current AUM is about 2.5 trillion. Of that number, about half is allocated to public equity and an even smaller number is dedicated to activist investment. So why do we care about activist investment so much? Perhaps it is American sensationalism or maybe we just like a good story, but whatever it is, every day we hear from the likes of Carl Icahn or Bill Ackman on CNBC, or in another media outlet. These brilliant and powerful investors outline their plan to unlock value in company XYZ, as if they are screaming from the top of the mountain for all to hear, through share buybacks, managerial shakeups, spin-offs, or other strategic planning and then back up their story with war chests full of their investors’ capital. As average investors, we are intrigued to see what the pros are doing, but we do not have access to these investors’ funds. So, how do we join in on the fun with these modern-day yodelers? We follow them closely and invest with them. But will this strategy generate alpha? The following study will provide the conclusion. I looked at 34 previous activist investments from some of the biggest players in the business. I took the share price of the day after the activist announced a position and marked this as a buy. We can follow activist activity through 13F filings online and through 13D filings in Barron’s. I then compared it to the day after the activist either won or lost proxy vote, or exited the position. The study will focus on long only as many average investors do not short or have the capability to do so. For example, we would buy Valeant Pharmaceuticals (NYSE: VRX ) the day after Bill Ackman announces a hostile takeout bid for Allergan (NYSE: AGN ), and then sell Valeant Pharmaceuticals the day Allergan rejected the offer and took the actavist’s bid. I then compared the returns of the individual stock to the market return of the S&P 500 over that time period to find if investing alongside the most famous hedgies in the world can generate alpha. Please read through for the data and the conclusion. Company Activist Activity Date Bought Date Sold Total Time held Share Price Buy Share Price Sell P/L S&P 500 Return Beta of Stock Reason for Activism Pershing Square Capital Management Allergan and Valeant 4/21/2014 10/18/2014 0.49 135 142 5.19% 0.79% 0.46 Buy out of Allergan. I calculated until the failure date to purchase Allergan. Pershing Square still owns a large portion. Bill Ackman J.C. Penney (NYSE: JCP ) 10/9/2010 9/2/2013 2.90 34 14.27 -58.03% 41.00% 1.34 Shake up of company. Appointment of Ron Johnson to CEO. Board Member. Failure. Air Products and Chemicals (NYSE: APD ) 9/1/2013 6/26/2015 1.82 109 143.83 39.95% 28.21% 1.42 Shake up of management, mainly CEO. Canadian Pacific Railway (NYSE: CP ) 10/31/2011 6/26/2015 3.66 61 162 167.67% 67.75% 1.07 Shake up of management. Trian Partners Nelson Peltz DuPont (NYSE: DD ) 7/18/2013 5/18/2015 1.83 57 70 27.81% 25.83% Spin-off of chemical units, break up of company. Tiffany (NYSE: TIF ) 2/27/2007 9/30/2011 4.59 45 63 48.00% -18.44% 1.93 Management shakeup. Undervalued. Wendy’s (NASDAQ: WEN ) 5/3/2008 6/26/2015 7.15 7.35 11.4 66.10% 51.43% 0.51 Management shakeup. Undervalued. Icahn Enterprises Carl Icahn Apple (NASDAQ: AAPL ) 10/25/2013 6/26/2015 1.67 75 127.5 72.50% 19.47% 1.07 Share buyback. Undervaluation. Dell 3/7/2013 9/10/2013 0.51 14 13.85 0.43% 8.56% — Transocean (NYSE: RIG ) 1/15/2013 6/26/2015 2.45 56.76 16 -62.81% 42.71% 1.6 Increase dividend. Undervalued Navistar (NYSE: NAV ) 11/20/2011 6/26/2015 3.60 38 22.75 -40.13% 81.44% 3.12 Restructuring. Management changes Starboard Value Jeffrey Smith Darden (NYSE: DRI ) 12/23/2013 6/26/2015 1.51 54.5 71.83 37.80% 15.01% 0.69 Restructuring, reevaluate strategic positioning, and managerial changes. MeadWestvaco (NYSE: MWV ) 6/3/2014 6/26/2015 1.06 43.63 47.89 17.76% 9.25% 0.55 Spin-off of specialty chemicals unit, undervalued, and sale of company. Brink’s (NYSE: BCO ) 5/4/2015 6/26/2015 0.14 30.61 30.23 -1.24% -58.00% 1.72 No plans as of yet. Office Depot (NASDAQ: ODP ) 8/8/2013 6/26/2015 1.88 4.2 8.89 111.67% 23.85% 2.75 Push for OfficeMax deal and sale of company to Staples (NASDAQ: SPLS ). AOL (NYSE: AOL ) 12/22/2011 6/15/2012 0.48 15.5 25.5 64.52% 6.13% — Managerial shakeup. Loss in proxy vote. Smithfield 6/18/2013 9/26/2013 0.27 33.11 33.99 2.66% 4.28% — Attempted breakup of company and sale. Failure and Chinese takeover by Shanghui took place at 34 a share. Gamco Mario Gabelli Brink’s 12/16/2014 6/26/2015 0.53 22.92 30.17 32.38% 6.57% 1.72 Gabelli claims that Brink’s is undervalued and should be private. Griffin Land (NASDAQ: GRIF ) 11/26/2013 6/26/2015 1.58 33 32.26 -1.49% 16.62% — Gabelli wants GRIF to examine itself as a REIT or MLP. Superior Industries (NYSE: SUP ) 11/26/2013 6/26/2015 1.58 18.9 18.69 4.89% 16.62% 0.93 Gabelli wants a share repurchase program. Third Point Dan Loeb Yahoo (NASDAQ: YHOO ) 10/3/2011 7/29/2013 1.82 15.47 27.65 78.73% 49.66% 1.46 Proxy vote success and shake up of board. Marissa Meyer new CEO. Jana Partners Barry Rosenstein McGraw-Hill (NYSE: MHFI ) 8/2/2011 9/12/2011 0.11 37.77 40.51 7.25% -7.78% 1.64 Breakup of company. Marathon Petroleum (NYSE: MPC ) 1/21/2012 2/20/2012 0.08 31.24 35 12.04% 4.15% 1.02 Operational changes to company and potential breakup. Agrium (NYSE: AGU ) 10/20/2012 3/5/2014 1.38 68.7 93.56 43.19% 30.69% 0.87 Return of capital to shareholders and split business. Ashland (NYSE: ASH ) 4/28/2013 5/13/2015 2.04 86 128.59 52.52% 31.81% 0.71 Restructuring, recapitalizations, spin-offs. Safeway (NYSE: SWY ) 8/20/2014 1/29/2015 0.44 24 35.1 46.25% 1.45% — Merger arb. and restructuring. QEP Resources (NYSE: QEP ) 10/22/2013 10/16/2014 0.98 32.9 23.33 -29.09% 6.66% 1.23 Midstream unit breakup. Elliot Management Paul Singer Hess (NYSE: HES ) 12/1/2012 6/26/2015 2.57 50 68.48 40.96% 49.16% 1.78 Managerial shake up and capital allocation changes. ValueAct Jeffrey Ubben Adobe (NASDAQ: ADBE ) 12/27/2011 1/13/2015 3.04 38.13 74.04 98.18% 58.32% 1.31 Managerial shake up. Moody’s (NYSE: MCO ) 7/20/2011 6/26/2015 3.93 35.61 110.2 213.46% 56.30% 1.36 Managerial shake up. Motorola 7/17/2011 6/26/2015 3.94 46.5 58.1 33.95% 56.30% 0.59 Work with management to unlock value. Relational Ralph Whitworth Occidental (NYSE: OXY ) 8/3/2010 5/3/2013 2.75 72.35 85.58 27.29% 43.22% 1.17 Removal of CEO, Ray Irani. Clinton Group Greg Taxin Violin Memory (NYSE: VMEM ) 12/19/2013 10/16/2014 0.83 4 4.16 4.00% 2.44% — Sale of company. (Taxin leaves Clinton Group on 10/16/14) XenoPort (NASDAQ: XNPT ) 10/15/2013 10/16/2014 1.00 6.02 6.41 6.48% 8.20% — Replace CEO. Total 34 Averages: 1.90 34.44% 26.93% 1.31 Return Per Year: 18.12% 14.17% Based on the data set, we see that following activist hedge funds does produce alpha. Over the course of the average investment of 1.90 years, the activist strategy returns an average of 18.12% per year versus the S&P 500 return of 14.17% over that time period. However, not taken into account are the trading costs of the transactions or the value of your time following the hedge fund activists. One important aspect to consider is that the average betas of the stocks are about 1.31. The higher return of the activist hedge fund strategy could just be a product of taking on more volatility to the market and may not represent any innate stock-picking ability. Another aspect to consider as an investor is whether or not activists add value (if you care about such a thing), as this can be widely debated. Did Valeant or Allergan add value when Ackman attempted to play matchmaker? Probably not, but there was still money to be made. Another important aspect to consider is when this study was done. All of the activist investments were done during the recent bull market that has generated returns of over 200% in six years. It has been shown that activists can even beat the market in periods of rapid asset appreciation, so I would hypothesize that a strategy of following activist investors would also be successful in a sideways or bear market. However, I do not have the empirical research to prove such a claim as the proliferation of activist investors has only just begun. This can provide a potential issue. As activist investors prove to make a lot of money and beat the market, we will see an influx of assets to this strategy that could dull down returns. I believe that this will not be an issue as you should always follow the big guys that have been doing this type of investing for a long time, for example, Bill Ackman, Dan Loeb, Mario Gabelli, Carl Icahn, Jeffrey Smith, Nelson Peltz, and Barry Rosenstein. There is one takeaway that is important to note after conducting this study. Picking activist investors are just like picking stocks, some are good during some times, and some not. Not all activist investors will always lead to gains every time, just like stocks. My advice is to evaluate an activist pick and only if you like the stock independently of the activist involvement, then buy in, otherwise you are better off in an index, like the SPY or MDY . If you do not know why you own something, don’t own it. Do your own work, but you can use these guys as idea generators. Do not follow Carl Icahn blindly into battle, even if he seems to be on a hot streak, because the market humbles everyone, even Mr. Icahn. Disclosure: I/we have no positions in any stocks mentioned, and no plans to initiate any positions within the next 72 hours. (More…) I wrote this article myself, and it expresses my own opinions. I am not receiving compensation for it (other than from Seeking Alpha). I have no business relationship with any company whose stock is mentioned in this article.