Tag Archives: investing ideas

16 Implications Of ‘The Phases Of An Investment Idea’

Registered investment advisor, bonds, dividend investing, ETF investing “}); $$(‘#article_top_info .info_content div’)[0].insert({bottom: $(‘mover’)}); } $(‘article_top_info’).addClassName(test_version); } SeekingAlpha.Initializer.onDOMLoad(function(){ setEvents();}); My last post has many implications. I want to make them clear in this post. When you analyze a manager, look at the repeatability of his processes. It’s possible that you could get “the Big Short” right once and never have another good investment idea in your life. Same for investors who are the clever ones who picked the most recent top or bottom… they are probably one-trick ponies. When a manager does well and begins to pick up a lot of new client assets, watch for the period where the growth slows to almost zero. It is quite possible that some of the great performance during the high-growth period stemmed from asset prices rising due to the purchases of the manager himself. It might be a good time to exit, or for shorts to consider the assets with the highest percentage of market cap owned as targets for shorting. Often when countries open up to foreign investment, valuations are relatively low. The initial flood of money often pushes up valuations, leads to momentum buyers, and a still greater flow of money. Eventually, an adjustment comes and shakes out the undisciplined investors. But when you look at the return series to analyze potential future investment, ignore the early years – they aren’t representative of the future. Before an academic paper showing a way to invest that would been clever to use in the past gets published, the excess returns are typically described as coming from valuation, momentum, manager skill, etc. After the paper is published, money starts getting applied to the idea, and the strategy will do well initially. Again, too much money can get applied to a limited factor (or other) anomaly, because no one knows how far it can get pushed before the market rebels. Be careful when you apply the research – if you are late, you could get to hold the bag of overvalued companies. Aside for that, don’t assume that performance from the academic paper’s era or the 2-3 years after that will persist. Those are almost always the best years for a factor (or other) anomaly strategy. During a credit boom, almost every new type of fixed-income security, dodgy or not, will look like genius by the early purchasers. During a credit bust, it is rare for a new security type to fare well. Anytime you take a large position in an obscure security, it must jump through extra hoops to assure a margin of safety. Don’t assume that merely because you are off the beaten path that you are a clever contrarian, smarter than most. Always think about the carrying capacity of a strategy when you look at an academic paper. It might be clever, but it might not be able to handle a lot of money. Examples would include trying to do exactly what Ben Graham did in the early days today, and things like Piotroski’s methods, because typically, only a few small and obscure stocks survive the screen. Also look at how an academic paper models trading and liquidity, if they give it any real thought at all. Many papers embed the idea that liquidity is free, and that large trades can happen where prices closed previously. Hedge funds and other manager databases should reflect that some managers have closed their funds, and put them in a separate category, because new money can’t be applied to those funds. That is to say, there should be “new money allowed” indexes. Max Heine, who started the Mutual Series funds (now part of Franklin), was a genius when he thought of the strategy 20% distressed investing, 20% arbitrage/event-driven investing and 60% value investing. It produced great returns in 9 years out of 10. But once distressed investing and event-driven because heavily done, the idea lost its punch. Michael Price was clever enough to sell the firm to Franklin before that was realized, and thus, capitalizing the past track record that would not do as well in the future. The same applies to a lot of clever managers. They have a very good sense of when their edge is getting dulled by too much competition and where the future will not be as good as the past. If they have the opportunity to sell, they will disproportionately do so then. Corporate management teams are like rock bands. Most of them never have a hit song. (For managements, a period where a strategy improves profitability far more than most would have expected.) The next-most are one-hit wonders. Few have multiple hits, and rare are those that create a culture of hits. Applying this to management teams – the problem is if they get multiple bright ideas or a culture of success, it is often too late to invest, because the valuation multiple adjusts to reflect it. Thus, advantages accrue to those who can spot clever managements before the rest of the market. More often this happens in dull industries, because no one would think to look there. It probably doesn’t make sense to run from hot investment idea to hot investment idea as a result of all of this. You will end up getting there once the period of genius is over and valuations have adjusted. It might be better to buy the burned-out stuff and see if a positive surprise might come. (Watch margin of safety…) Macroeconomics and the effect that it has on investment returns is overanalyzed, though many get the effects wrong anyway. Also, when central bankers and politicians take cues from the prices of risky assets, the feedback loop confuses matters considerably. if you must pay attention to macro in investing, always ask, “Is it priced in or not? How much of it is priced in?” Most asset allocation work that relies on past returns is easy to do and bogus. Good asset allocation is forward-looking and ignores past returns. Finally, remember that some ideas seem right by accident – they aren’t actually right. Many academic papers don’t get published. Many different methods of investing get tried. Many managements try new business ideas. Those that succeed get air time, whether it was due to intelligence or luck. Use your business sense to analyze which it might be, or if it is a combination. There’s more that could be said here. Just be cautious with new investment strategies, whatever form they may take. Make sure that you maintain a margin of safety; you will likely need it. Disclosure: None. Share this article with a colleague
Weak Wages And Weaker Manufacturing, But How ‘Bout Those Rate Hike Expectations!

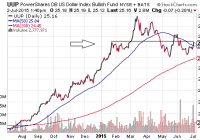
When half of the employed folks make less than what it takes to support one’s self, the wage growth required for a stronger economy cannot suddenly appear. Rather, increases in consumption must rely entirely on low-rate debt binging. Crafting a positive spin on the economy should not be a substitute for frank discussions on the actual state of affairs. I started working at the age of 13. I wanted to be productive. I wanted to make money. Gardener, golf caddy, food deliverer, waiter, bartender, entrepreneur, researcher, analyst, writer, planner, adviser, money manager – I probably spent as much time cursing and complaining as I did whistling. Nevertheless, thirty five years of work contributed to my well-being as well as the well-being of others. Will people from my generation (“Gen X”) leave the workforce anytime soon? Not if we intend to maintain our lifestyles. In fact, Gen Xers aren’t slated to begin retiring in earnest until 2030. We may have grown up as apathetic slackers, yet studies routinely demonstrate that those born between 1961 and 1981 are exceptionally industrious. (Good looking too.) So why are Gen Xers and post-World War II baby boomers leaving the workforce at an accelerated pace during this economic recovery? For example, today’s jobs report celebrated the creation of 223,000 new jobs in June and a 5.3% unemployment rate, while barely mentioning that 432,000 civilian workers disappeared from the labor force altogether. At present, a record 93.6 million of the U.S. working-aged population are no longer in the picture, resulting in the employment rate/participation rate hitting 1977 levels of 62.6%. It actually gets worse. There are roughly 100 million Americans out of 160 million Americans considered by the Bureau of Labor Statistics ( BLS ) as fully employed. Yet it has been estimated that 1/2 of those 100 million earn less than $15,000 annually as part-timers or self-employed workers. Should we really be declaring an annual income of $15,000 as sufficient for a spot in the full-time work column? Houston, we’ve got a problem. And I’m not even referring the planned layoffs across the oil and gas space. For one thing, when half of the employed folks make less than what it takes to support one’s self, let alone support children or elderly family members, the wage growth required for a stronger economy cannot suddenly appear; rather, increases in consumption must rely entirely on low-rate debt binging. Can you say, low rates for longer? Secondly, crafting a positive spin on the economy should not be a substitute for frank discussions on the actual state of affairs. Specifically, popular media outlets like the Associated Press have little business calling a tepid jobs report “solid.” In the absence of any month-over-month wage growth? In spite of downward revisions to job growth in prior months? With employment gains only keeping up with population gains? Indeed, the Associated Press even acknowledged that the employment rate/workforce participate rate fell because people out of work gave up on the pursuit and no longer count in the unemployed tally. How exactly is this a topnotch turn of events? There are two key ramifications of today’s data from the BLS as well as ancillary manufacturing data from the U.S. Census Bureau. First, the idea that the dollar can only move higher in light of China uncertainty and euro-zone complications is flawed. Expectations for the timing and the extent of rate hikes by the Fed continue to diminish with every lackluster economic presentation. Since the dollar had already priced in the end of quantitative easing in the U.S. and the eventual beginning of eurozone quantitative easing, I’m more inclined to expect the dollar via the PowerShares DB USD Bull ETF (NYSEARCA: UUP ) to end 2015 very near where it is today. Next, prominent sector investments like industrials and transports will continue to underperform. Simply stated, factory orders have fallen in nine out of the last 10 months; the seasonally adjusted year-over-year decline in factory orders is 6.3%. Strong dollar excuses notwithstanding, this type of data is entirely recessionary. In fact, it’d be difficult to find a period where the weakness in demand for U.S. manufactured goods was this low and it wasn’t associated with economic recession. As I have discussed on many prior occasions, one does not necessarily need to pare back core positions like the iShares S&P 100 ETF (NYSEARCA: OEF ). Not unless one is employing a disciplined approach to risk reduction . Still, if you have been holding onto an allocation to the Industrial Select Sector SPDR ETF (NYSEARCA: XLI ) or the iShares Transportation Average ETF (NYSEARCA: IYT ), consider taking profits. Technical analysis of the sectors suggest further erosion of price, and neither the BLS employment data nor the U.S. Census Bureau manufacturing data indicate a quick turnaround. Disclosure: Gary Gordon, MS, CFP is the president of Pacific Park Financial, Inc., a Registered Investment Adviser with the SEC. Gary Gordon, Pacific Park Financial, Inc, and/or its clients may hold positions in the ETFs, mutual funds, and/or any investment asset mentioned above. The commentary does not constitute individualized investment advice. The opinions offered herein are not personalized recommendations to buy, sell or hold securities. At times, issuers of exchange-traded products compensate Pacific Park Financial, Inc. or its subsidiaries for advertising at the ETF Expert web site. ETF Expert content is created independently of any advertising relationships.

VQTS: A Large Cap Investment That Protects Itself

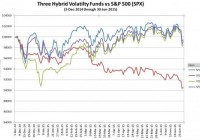
In my opinion the UBS ETRACS S&P 500 VEQTOR Switch ETN ( VQTS) is the best exchange traded product for solving the essential conundrum of the stock market: how to run with the bulls without getting eaten by the bears. The algorithms in VQTS are tuned to outperform the other hybrid volatility funds like the Barclays ETN+ VEQTOR S&P 500 Linked ETN ( VQT) and the VelocityShares Volatility Hedged Large Cap ETF ( SPXH) during good times and to be competitive during the bad times. We don’t have much trade data since UBS only introduced VQTS on December 3rd, 2014. It stumbled in its first month of trading, but then recovered during the first half of 2015-now lagging SPX by only 0.5% since its inception. All of the hybrid volatility funds dynamically allocate assets into the S&P 500 (SPX), VIX futures, and cash depending on market conditions. VQTS is the first fund of this type that invests all of its assets into the S&P 500 when the market’s overall volatility is low. This avoids the costs of hedging when the market is least likely to go down-during the long upward stretches of bull markets. In comparison, two similar funds, Barclays’ VQT and the PowerShares S&P 500 Downside Hedged Portfolio ETF ( PHDG) both have at least 2.5% of their assets allocated to long volatility-and that small amount significantly drags down their returns during bull markets. The chart below compares the simulated performance of VQTS compared to SPX, VQT, and SPXH from early 2006. VQTS defines low volatility as being historical volatility less than 10% using the higher of two exponentially weighted moving averages on volatility. If realized volatility climbs above 20% VQTS starts holding cash and volatility securities (2/3rds cash, 1/3rd volatility) in addition to the large cap S&P 500. The table below shows the range of asset allocations as realized volatility increases. VQTS Asset Allocations Realized Volatility (exponentially weighted) Equity % Volatility % Cash % 0% to 10% 100% 0% 0% 10% to 20% 90% to 80% 3.3% to 6.7% 6.7% to 13.3% 20% to 30% 80% to 70% 6.7% to 10% 13.3% to 20% 30% to 40% 70% to 60% 10% to 13.3% 20% to 26.7% 40% to 50% 60% to 50% 13.3% to 16.7% 26.7% to 33.3% 50% to 60% 50% to 40% 16.7% to 20% 33.3% to 40% 60% to 70% 40% to 30% 20% to 23.3% 40% to 46.6% 70% to 80% 30% to 20% 23.3% to 26.7% 46.6% to 53.3% 80% to 90% 20% to 10% 26.7% to 30.0% 53.3% to 60% In October 2008 the realized volatility as computed by VQTS’ algorithms peaked at 82% When not fully allocated to equities VQTS takes a long or short position in VIX futures depending on the curvature of the futures’ term structure. The term structure is the curve that’s formed if you plot VIX futures’ price vs time to expiration. The decision to go long or short is determined by the comparison between the slope of the two nearest to expiration futures (1st and 2nd) and the slope of the 4th and 7th month futures. I’ve marked up the chart below from vixcentral.com to illustrate the calculation. VQTS’ curvature calculation is similar, but not identical to the more familiar designations of contango and backwardation for futures’ term structures. In general VQTS will go long volatility if the term structure is in backwardation (futures prices less than spot), and short volatility if the curve is in contango. This approach would have worked well in the past, profiting from the fast rise of volatility as a crash / big correction develops, and then switching to be short volatility as volatility mean reverts. The chart below shows the simulated performance of VQTS during the 2008/2009 crash. VQTS experienced around a 20% drawdown in the fall of 2008 before rallying to a year end gain of +13%. Many strategies that backtest well on historical data do not perform well once they go live, but as I noted at the beginning of this post VQTS has already shown that it can approximate the S&P 500 during periods of low volatility-the condition the market is in 75% of the time. VQTS’ drawdowns during crashes and corrections are likely to be significant, but VQTS’ strategy of going long volatility during panicky periods and short volatility during the recovery should continue to work well as a way to power through downturns. VQTS is still a small fund with only $25 million in assets, so investors are hesitant to invest in it, but since the S&P 500 and VIX futures are its underlying securities its liquidity is excellent. Bid/ask spreads have been reasonable-in the 6 to 7 cent range (0.3%). Over time I expect its assets to grow into the $500 million range of its closest competitors, VQT and PHDG. Everyone knows this bull market will end, the tough part is guessing when. With VQTS you can ride the bull and be prepared for the inevitable bad ending. Disclosure: None