Tag Archives: income

2 High-Yield Utility Stocks To Buy For 2015
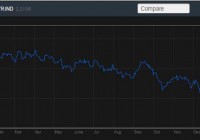
Summary DUK and AEP are set to deliver healthy performances in the coming year. Efforts to increase regulated operations will fuel future growths of both companies. DUK and AEP offer safe dividend yields. Utility stocks have been an admired investment choice for dividend-seeking investors, as they offer high dividend yields. In 2014, the utility sector delivered healthy results and performed better than the S&P 500. The healthy performance of the utility sector can be mainly attributed to a low treasury yield environment. Going forward, I believe utilities will perform well in 2015 due to the prevalent low treasury yield environment, the measures taken by utility companies to improve operational productivity, and continuous efforts by utilities to reduce competitive power operations. As I believe utility sector will deliver a healthy performance next year, I recommend investors to buy two utility stocks, namely American Electric Power (NYSE: AEP ) and Duke Energy (NYSE: DUK ), in 2015. AEP and DUK are positioned well in the industry to deliver a healthy performance in 2015. Also, both stocks offer attractive and safe dividend yields. The following graph shows the declining trend for 10-Year Treasury Yield. Source: Bloomberg.com 2 Stocks for 2015 The utility sector has performed better than the S&P 500 in 2014. And as we head into 2015, I believe the utility sector will deliver a healthy performance next year as well. The low treasury rate environment, efforts to improve operational efficiencies, and lower competitive power operations across the industry will support the utility sector’s performance in 2015. The following table shows the performance of the S&P 500, the utility sector, DUK, and AEP in 2014 year-to-date. S&P 500 Utility Sector ETF (NYSEARCA: XLU ) DUK AEP 2014 – Year-to-date Performance 13% 29% 26% 34.5% Source: Bloomberg.com As the competitive business operations of U.S. utility companies have remained challenging, due to weak capacity revenues and commodity prices, companies have been making efforts to lower their competitive operations. Efforts to lower competitive operations will portend well for companies’ bottom-line numbers and cash flows in future. Many utility companies, including AEP, DUK, PPL Corp. (NYSE: PPL ), Exelon (NYSE: EXC ), have been making efforts to lower their competitive operations. DUK will benefit in the coming year from an increase in its capital expenditures. Also, the company has been addressing the challenges in competitive business operations by selling its unregulated assets. The company, in 4Q’14, sold its competitive power assets in the Midwest for $2.8 billion. The transaction will positively affect the bottom-line numbers of the company in future, as the Midwest assets were posting weak results and were weighing on the company’s total EPS. The company intends to use the cash from the assets sale to expand its regulated operations. The company plans to make capital expenditures of $18 billion (midpoint) from 2014-2018, which includes $7 billion (midpoint) for new generation facilities. The capital expenditures that DUK has planned will help it expand its regulated operations and fuel its top and bottom-line growth. Analysts are anticipating a healthy next five-year growth rate of 4.8% for DUK. Along with healthy growth prospects, the stock offers a high dividend yield of 3.90% . DUK has consistently increased dividends over the years, and the healthy future growth prospects promises further increases in dividends. Also, the dividends offered by DUK are backed by its cash flows, evident from its healthy dividend coverage ratio. Moreover, the company has been successfully increasing its ROE in recent years. The following table shows the increase in dividends per share and ROE over the years, the dividend payout ratio, and the dividend coverage ratio for DUK. (Note * Dividend coverage ratio = operating cash flow/annual dividends, and 2014 figures below are based on estimates). Dividend Per Share ($) Dividend Payout Ratio Dividend Coverage* ROE 2012 $3.03 70% 3x 9.5% 2013 3.12 71% 2.9x 10.7% 2014 * 3.15 70% 3.1x 11.5% Source: Company Reports and Calculations AEP is among the leading utility companies in the U.S. As the competitive business operations remain challenging, AEP has been making efforts to decrease its competitive operations and expand regulated operations. The increase in regulated operations will provide EPS strength for the company. Also, the capital expenditure that AEP has been making will help it fuel its top and bottom-line numbers growth through rate case hikes. The company, in efforts to increase its regulated business, is expected to make capital expenditures of $12 billion from 2015-2017. Also, AEP is focusing on increasing its regulated transmission business in the coming years, and as a result, its transmission segment’s EPS is expected to grow to $0.67 in 2017, up from $0.30 in 2014. Capital expenditures by AEP to expand regulated operations will fuel its future growth. Due to the company’s healthy growth efforts, analysts are anticipating a healthy next five-year earnings growth rate of 4.95% for AEP. The following chart shows the capital expenditure forecast for AEP from 2015-2017. Source: Company Reports Other than attractive growth opportunities, the company offers a safe dividend yield of 3.6% . Dividends offered by the company have increased consistently over the years, and have been backed by its strong cash flows. In the future, dividends are expected to grow consistently due to the company’s growth efforts. The following table shows the increase in dividends per share over the years, dividend payout ratio and dividend coverage ratio for AEP. (Note * Dividend coverage ratio = operating cash flow/annual dividends, and 2014 figures below are based on estimates). Dividend Per Share ($) Dividend Payout Ratio Dividend Coverage* 2012 1.88 60% 4.1x 2013 1.95 60% 4.5x 2014 * 2.02 55% 4x Source: Company Reports and Calculations Conclusion I believe the utility sector will continue to perform well in 2015. I recommend investors to buy DUK and AEP for 2015, as both stocks are set to deliver healthy performances in the coming year. Both companies are expected to enjoy healthy growth in the next five years, and efforts to increase regulated operations will fuel future growths. Also, DUK and AEP offer safe dividend yields, which make both stocks attractive investment options for dividend-seeking investors. The following table shows the dividend yields and next five-year growth rates for DUK and AEP. Dividend Yield Next 5 Year Growth Rate DUK 3.9% 4.8% AEP 3.6% 4.95% Source: Yahoo Finance and nasdaq.com

Updates: Utility Firms Otter Tail, Avista, And Exelon

None of the three firms has outperformed the Morningstar index of diversified utilities over the previous 5-yr and 10-yr timeframes. Exelon is most undervalued based on an anticipated 12% EPS growth rate, but fairly valued based on historic P/E ratios. Even with depressed earnings due to weak power markets, Exelon has generated 3-yr average returns on invested capital above their cost of capital while the other two firms have not. Avista has the best regulatory environment assessment profile and is the greatest “pure-play” regulated utility of the three. Recently, a newsletter subscriber and avid SA reader requested I review and update a few utilities, and I am obliging him by evaluating small-cap Otter Tail Corp. (NASDAQ: OTTR ), small-cap Avista Corp. (NYSE: AVA ) and large-cap Exelon Corp. (NYSE: EXC ). These are very different utilities, each with its own attributes and performance. However, they all have one common attribute – each is classified as a diversified utility. As the Morningstar performance graph shows below, 5-yr performance is vastly different, from a 13% annual total return to a -2.2% annual total return. Total Return Performance OTTR 5-Yr Total Return Performance AVA 5-Yr Total Return Performance EXC 5-Yr Total Return Performance As shown, AVA would have been the best pick of the three in 2009 and EXC the worst. However, none of them has outperformed the Morningstar index of diversified utilities over the previous 5-yr and 10-yr time frames. Business Description What do these companies do? From their boilerplate descriptions on their website: OTTR Otter Tail Corporation is engaged in electric and non-electric operations primarily in the United States, Canada, and Mexico. It operates in four segments: Electric, Manufacturing, Plastics, and Construction. The Electric segment produces, transmits, distributes, and sells electric energy in Minnesota, North Dakota, and South Dakota, as well as operates as a wholesale participant in the Midcontinent Independent System Operator, Inc. markets. This segment serves approximately 130,000 customers. AVA Avista Corp. is an energy company involved in the production, transmission and distribution of energy as well as other energy-related businesses. Avista Utilities is our operating division that provides electric service to 368,000 customers and natural gas to 325,000 customers. Its service territory covers 30,000 square miles in eastern Washington, northern Idaho and parts of southern and eastern Oregon, with a population of 1.5 million. Alaska Energy and Resources Company is an Avista subsidiary that provides retail electric service in the city and borough of Juneau, Alaska, through its subsidiary Alaska Electric Light and Power Company. EXC Exelon Corporation is the nation’s leading competitive energy provider, with 2013 revenues of approximately $24.9 billion. Headquartered in Chicago, Exelon does business in 48 states, the District of Columbia and Canada. Exelon is one of the largest competitive U.S. power generators, with more than 35,000 megawatts of owned capacity comprising one of the nation’s cleanest and lowest-cost power generation fleets. The company’s Constellation business unit provides energy products and services to more than 2.5 million residential, public sector and business customers, including more than two-thirds of the Fortune 100. Exelon’s utilities deliver electricity and natural gas to more than 7.8 million customers in central Maryland (BGE), northern Illinois (ComEd) and southeastern Pennsylvania ( OTC:PECO ). Fundamental Ratios Below is a table outlining a few current fundamental ratios: Source: Morningstar, MyInvestmentNavigator.com While EXC has the lowest historical returns, it also has the lowest forward PEG ratio, or the 2015 PE ratio divided by 5-yr anticipated growth rate, and is valued at about 1/3 of its peers. This is due to the doubling of its anticipated EPS growth rate compared to peers. EXC also trades at half the price to cash flow ratio of OTTR. Reviewing two important 15-yr FASTgraph charts for each firm would provide the following comparison: OTTR: Earnings, Dividends and Price OTTR: Return on Invested Capital (click to enlarge) AVA: Earnings, Dividends and Price AVA: Return on Invested Capital (click to enlarge) EXC: Earnings, Dividends and Price EXC: Return on Invested Capital (click to enlarge) Based on historic PE ratios, OTTR could be considered slightly undervalued with AVA and EXC at fair valuations. However, both EXC and OTTR have not yet recouped their stock price highs reached prior to the recession of 2008. Both OTTR and AVA have generated Return on Invested Capital in line with the industry average of 5% while EXC has historically outdone its peers by a wide margin for generating returns on its total capital structure. Even during its current depressed power-pricing environment, EXC has generated at a minimum peer-like returns on invested capital. Return on Invested Capital, Weighted Average Cost of Capital, Net ROIC Using the work of ThatsWACC.com as a source for easily finding a company’s weighted average cost of capital WACC, below is a table outlining the average ROIC, WACC , and Net ROIC (ROIC minus WACC) for each company: Source:ThatsWACC.com, MyInvestmentNavigator.com It becomes obvious EXC has generated 3-yr average returns on invested capital above their cost of capital while the other firms have not. Distributed Generation Policy A utility’s approach to distributed generation is becoming a consideration for investors. As residential and commercial customers continue installing intermittent generation by solar power, the impact on each utility will be magnified over time. Not only will the individual company’s policy affect future earnings, but also the state-approved financial aspects of distributed generation will influence investment decisions. Otter Tail Distributed Generation: OTTR is now subject to the first state-mandated and PUC-approved “Value of Solar Tariff” or VOST. This concept replaced the often used “net metering” approach to pricing power used by and sold by independent retail solar power generation, also known as distributed generation. The program in Minnesota is described in an article on utilitydrive.com : “VOST preserves much of the simplicity of net metering,” he explained, but “instead of netting the kilowatt-hours consumed and produced, the customer nets the dollars paid for energy [at the retail electricity rate] with the dollars earned selling solar energy to the utility [at the value of solar rate].” The other major difference is that VOST is “locked in by a solar energy producer on a 25-year contract,” Farrell wrote. Both NEM and VOST could go up or down over time, “but Minnesota’s law gives solar energy producers surety by guaranteeing their per-kilowatt-hour payment for the expected life of the solar panels.” Avista Distributed Generation: According to a publication from Western Energy Board: “The Company views DG as not a threat but as another choice available to the utility. In the future there will be a vibrant market for personalized power that uses DG technology.” Exelon Distributed Generation: EXC has been vocal on its position concerning distributed generation. CEO Crane offered the following quotes from an article last May in Forbes: “It has been a year of dire warnings for utilities as rooftop solar has begun to compete with the traditional electricity system, but it’s too early to start digging the grave for utilities, the CEO of Exelon Corp. said this afternoon at an appearance in Washington D.C. ‘At this point in all of the evaluations that we continue to do, we cannot see an economic focused technology that will replace the scale and the economy of central-station power,’ Chris Crane said… Crane called for developing a system ‘that enables distributed generation and supports it,’ but that also compensates utilities, and their shareholders, for their investment in the grid… ‘In our markets we don’t have the utility developing the distributed generation source. That is opened up to competition. We create the grid situation where they can sell that power back out onto the system. This is an Exelon opinion that’s morphing,’ he added. ‘I think right now that’s the opinion. I’m looking around at some Exelon eyes in the room to see if they’re saying, ‘You’re crazy,’ because that debate is not done yet.'” Distributed generation is important enough for EXC to occupy an entire page from their most recent investors presentation at the 2014 Edison Electricity Institute Financial Conference (pg. 12, link below): Distributed Energy is a Fast Growing Business: •On-site generation, including solar, quadrupled since 2006 (Wall Street Journal 2013) •US C&I customers are spending ~$5-6 billion per year on self-generation and energy efficiency programs (Bloomberg 2013) •Revenues from Distributed Generation are expected to reach $12.7 billion by 2018 (Pike Research, Navigant, 2012) Regulatory Environment S&P Credit offers an opinion of the regulatory environment by state for public utilities. In 2013, their categories underwent a dramatic shift and now utilities are classified into just three categories, down from the previous four. The best is now considered “Strong”, with a neutral rating as “Strong/Adequate” and the worst as “Adequate”. Prior to 2013, states were rated as “More Credit Supportive”, “Credit Supportive”, “Less Credit Supportive”, and “Least Credit Supportive”. Prior to 2013, 34% of states were less than credit supportive while the rework in 2013 dropped the number to just 6%. Being somewhat skeptical that there was a huge shift of favorable sentiment towards utilities by individual state utility commissions, the pre-2013 assessments could be considered as more accurate. Below are the respective state rankings prior to 2013. Source: Standard and Poors, MyInvestmentNavigator.com Regulated vs. Non-Regulated Businesses Going forward, Otter Tail offers interesting non-utility growth potential. While trailing 12-month revenues were 57% from non-utility businesses ($546 million out of $950 million), TTM operating profits still favor the regulated business. 67% of the $109 million in TTM net operating profits were generated from utility assets. This equates to net operating profit margins of 18.0% for utility vs. 10.4% for non-utility operations. Below is a breakdown of earnings per share estimates by OTTR operating segment, as offered in their latest investor presentation (link below). (click to enlarge) Avista offers diversity in regulated western states. As a small-cap utility with little revenues from non-regulated businesses, AVA offers the most “pure-play utility” of the three. In addition, AVA may be an intriguing acquisition candidate based on its geographic territory and its high exposure to renewable power generation using wind and hydroelectric assets. Exelon is the most unloved utility, not only of the three above but also within the entire sector as a whole. Its checkered past has led to many utility investors disillusioned and jilted concerning the firm’s future. While regulated utility operations comprise the vast majority of revenues and earnings for OTTR and AVA, Exelon’s regulated earnings will be about 55% of the total, even after the mostly regulated Pepco Holdings (NYSE: POM ) merger is complete. Summary More information in previous SA articles can be found in an AVA article from Aug. and an EXC article from Oct. The following are links for the most recent Investor presentations: Otter Tail , Avista , and Exelon . Based on a turn in Northeast, Mid-Atlantic and Midwest wholesale power markets, driven by new PJM pricing models for reliability and a rising natural gas price, EXC should offer the best potential for rising stock prices. However, it also carries the most risk if anticipated electricity pricing does not improve. My money is on EXC for the longer term. Author’s Note: Please review important disclaimer in author’s profile.