MLPY: Now Yielding 12.6% With Reduced Upstream Exposure
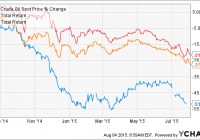
Summary With the recent carnage in the energy sector, the yield of MLPY has increased to 12.6% on a ttm basis. MLPY offers more diverse exposure to energy-related MLPs compared to the most popular MLP funds, which are dominated by midstream MLPs. MLPY has significantly reduced exposure to upstream MLPs compared to six months ago, which may offer some protection against further declines in crude prices. Introduction Energy-related stocks and funds have been hammered recently as the price of oil continues to fall. The chart below shows the recent price action of crude oil, the U.S. energy sector (via the Energy Select Sector SPDR ETF (XLE )), and the popular midstream MLP fund, the JPMorgan Alerian MLP ETN (NYSEARCA: AMJ ). WTI Crude Oil Spot Price data by YCharts In a previous series of three articles, I covered characteristics of three lesser-known MLP funds: the Morgan Stanley Cushing MLP High Income Index ETN (NYSEARCA: MLPY ), the Yorkville High Income MLP ETF (NYSEARCA: YMLP ) and Global X Junior MLP ETF (NYSEARCA: MLPJ ). I was attracted to these funds due to their high yields as well as their more diverse stock mix compared to the most popular MLP funds such as AMJ and the Alerian MLP ETF (NYSEARCA: AMLP ). Besides midstream MLPs, those three funds also contained exposure to GPs, upstream MLPs, diverse MLPs, variable MLPs, and “other” MLPs, as defined by the CBRE Clarion Securities MLP Master List . Moreover, those three funds had a much lower average market capitalization than the two large-cap MLP funds AMJ and AMLP. Unfortunately, this diversification acted against those three funds over the past several months. Small-cap and upstream MLPs were especially hard-hit as investors fretted over the financial health of such companies. AMJ Total Return Price data by YCharts With the decline in MLPY’s unit price, its yield has now increased to an alluring 12.6% on a trailing twelve-months [ttm] basis. With the July rebalance also having recently been completed, I thought that now would be a good time to provide an update on this fund to determine whether it is still a good investment. Moreover, this article describes the inclusion and weighting methodology for MLPY, something that I did not do in my previous article. MLPY methodology MLPY contains 30 MLPs and the methodology for their inclusion is reproduced below from the fund website . The 30 MLPs in the Index are tiered as follows: [I] the first tier includes those 10 MLPs that have the highest current indicative yield and a market capitalization of $1 billion or more, with each first tier constituent assigned a 5% weighting; [II] the second tier includes those 10 MLPs that have the highest current indicative yield and a market capitalization of $750 million or more, with each second tier constituent assigned a 3.5% weighting; [III] the third tier includes those 10 MLPs that have the highest current indicative yield and a market capitalization of $500 million or more, with each third tier constituent assigned a 1.5% weighting. This methodology favors high-yielding MLPs, but has conditions on market cap to ensure that the index is not dominated by small-cap holdings. Specifically, a company has to have a market cap of $1B or more to be assigned with a 5% weighting, a market cap of $750M or for a 3.5% weighting, and a market cap of $500M or more for a 1.5% weighting. MLPs with less than $500M capitalization are excluded, which is why we don’t see companies such as Atlas Resource Partners L.P. (NYSE: ARP ), yielding a fantastic 38% but with a market capitalization of only $300M, in the index. Additionally, there is an additional criterion for dividend stability: Each constituent security candidate must have maintained or increased its distributions over the previous four fiscal quarters. An exception will be made for new listings or issuers that move to a national securities exchange from another dealer market or over the counter exchange. Such issuers must maintain the above standards moving forward from the new or re-listing date. While excluding dividend-cutters sounds like a perfectly reasonable filter, it should be noted that a dividend cut is often accompanied by a severe damage to the unit price of the MLP (see Linn Energy (NASDAQ: LINE ) for the most recent example). This means that the fund will have no choice but to “sell low” as it removes the dividend-cutters from the index during its quarterly rebalancing event. In fact, the aforementioned ARP was a 5%-weighted constituent of MLPY as recently as six months ago. Composition The constituents of MLPY are given in the table below. Also shown is the % assets, current yield, market cap and type of each constituent . Note that as an ETN, the holdings of MLPY are not publicly available on a daily basis. The % assets are obtained from the company while the current yield and market cap are obtained from Seeking Alpha. In categorizing the type of company, I have used the classification types in the CBRE Clarion Securities MLP Master List website, which considers these following MLP or MLP-related classes: [i] traditionally structured midstream MLPs, [ii] upstream MLPs, [iii] traditionally structured other MLPs (“other”), [iv] variable distribution MLPs (“variable”), [v] MLP GP holding companies (“GP”), [vi] other publicly-traded companies that own GP interest in an MLP (“diverse”), and [vii] other MLP-related securities. Name Ticker Assets / % Yield / % Cap / B Type NGL Energy Partners LP (NYSE: NGL ) 6.43 9.3 2.88 Midstream Ferrellgas Partners LP (NYSE: FGP ) 5.46 9.5 1.88 Other Calumet Specialty Products Partners LP (NYSE: CMLP ) 5.44 10.3 2.01 Other Energy Transfer Partners LP (NYSE: ETP ) 5.39 8.2 25.2 Midstream Golar LNG Partners LP (NASDAQ: GMLP ) 5.12 11.2 1.27 Other Teekay Offshore Partners LP (NYSE: TOO ) 5.03 12.8 1.55 Other Memorial Production Partners LP (NASDAQ: MEMP ) 5.00 24.6 0.75 Upstream DCP Midstream Partners LP (NYSE: DPM ) 4.62 10.5 3.40 Midstream Williams Partners LP (NYSE: WPZ ) 4.39 7.5 27.3 Midstream Crestwood Midstream Partners LP 4.27 17.2 1.80 Midstream Seadrill Partners LLC (NYSE: SDLP ) 3.85 19.1 1.09 Other Crestwood Equity Partners LP (NYSE: CEQP ) 3.84 15.2 0.68 GP Exterran Partners LP (NASDAQ: EXLP ) 3.64 11.1 1.21 Other Targa Resources Partners LP 3.52 9.4 6.33 Midstream Navios Maritime Partners LP (NYSE: NMM ) 3.47 17.5 0.84 Other Martin Midstream Partners LP (NASDAQ: MMLP ) 3.46 11.3 1.02 Midstream ONEOK Partners LP (NYSE: OKS ) 3.22 10.1 8.03 Midstream Capital Product Partners LP (NASDAQ: CPLP ) 3.16 12.4 0.80 Other Alliance Resource Partners (NASDAQ: ARLP ) 2.96 11.1 1.81 Other Summit Midstream Partners LP (NYSE: SMLP ) 2.58 7.8 1.72 Midstream Transocean Partners LLC (NYSE: RIGP ) 1.72 11.5 0.87 Other AmeriGas Partners LP (NYSE: APU ) 1.60 8.0 4.27 Other NuStar Energy LP (NYSE: NS ) 1.59 8.0 4.29 Midstream Suburban Propane Partners LP (NYSE: SPH ) 1.59 9.5 2.27 Other Global Partners LP (NYSE: GLP ) 1.50 8.8 0.97 Other CSI Compressco LP (NASDAQ: CCLP ) 1.48 13.9 0.48 Other Teekay LNG Partners LP (NYSE: TGP ) 1.46 10.5 2.10 Other Hi Crush Partners LP (NYSE: HCLP ) 1.46 12.1 0.58 Other Foresight Energy LP (NYSE: FELP ) 1.44 18.4 1.05 Other SunCoke Energy Partners LP (NYSE: SXCP ) 1.33 15.4 0.59 Other We can see from the table above that in addition to midstream MLPs (39%), MLPY also contains a significant proportion of “other” (52%) MLPs. According to CBRE, “other” MLPs include all MLPs that are not midstream MLPs, but are structured like midstream MLPs (with a minimum quarterly distribution). These include coal, compression, shipping, oilfield services, wholesale distribution, and everything else. (Note: other authorities classify wholesale distribution as midstream). Examples of “other” MLPs in MLPY include Capital Product Partners, a diversified shipping company in the seaborne transportation of fuels and other cargoes, Ferrellgas Partners, a supplier of propane, and Alliance Resource Partners, a diversified coal producer and marketer. The allocations of MLPY are depicted in the chart below. How does this composition compared to six months ago ? The following chart shows the former, current and changes in the four categories of MLPs in MLPY from six months ago to now. We can see from the chart above that the proportion of midstream holdings in MLPY has remained relatively constant. However, there has been a big decrease (-24% in absolute terms) in the proportion of upstream MLPs in fund, which has been accompanied by a large increase (+20% in absolute terms) of “other” MLPs. Examples of upstream MLPs that have been removed from the fund over the past six months include ARP, LINE and Vanguard Natural Resources (NASDAQ: VNR ), while examples of “other” MLPs that have been added include RIGP, GMLP and TOO. For investors who are worried about a prolonged period of crude oil prices, this shift away from upstream MLPs and towards “other” MLPs is a welcome change. With only 5% of upstream MLP exposure, the fund should now be “relatively” more protected against further declines in crude prices compared to six months ago. Distribution Since my last article, MLPY has paid out 3 more distributions. While the first of these was the highest-ever in the history of MLPY, the most recent two have unfortunately shown a declining trend. This is not surprising as several higher-yielding upstream MLPs were removed from the index due to dividend cuts. While a comprehensive analysis of the dividend sustainability of each individual MLP is beyond the scope of the article, it is hoped that a reduced exposure to upstream MLPs will increased the stability of the distribution from MLPY going forward. Risks MLPY contains companies that are smaller in size compared to those found in the large-cap funds AMLP or AMJ. Moreover, energy-related MLPs are (to various extents) acutely sensitive to commodity prices, and the 12.6% distribution may or may not be sustainable. Additionally, MLPY’s expense ratio is 0.85%, which is the same as that for AMLP and AMJ. Finally, MLPY is an ETN, which means that investors are exposed to the credit risk of the issuer, in this case Morgan Stanley. Conclusion Since six months ago, MLPY has significantly increased its exposure to “other” MLPs while significantly decreased its exposure to upstream MLPs. With only 5% exposure to upstream companies remainder, MLPY can be considered to be more protected against further declines in crude oil prices compared to its situation six months ago. Moreover, MLPY’s yield now sits at an attractive 12.6% on a ttm basis. The reason I have chosen MLPY as an investment is because I am not comfortable with picking individual energy MLPs, especially in such as volatile environment as right now. Moreover, by having a significant exposure to “other” MLPs, which although are energy-related should be less acutely sensitive to crude prices compared to upstream MLPs, provides nice diversifying element to the fund. Disclosure: I/we have no positions in any stocks mentioned, but may initiate a long position in MLPY over the next 72 hours. (More…) I wrote this article myself, and it expresses my own opinions. I am not receiving compensation for it (other than from Seeking Alpha). I have no business relationship with any company whose stock is mentioned in this article.