Tag Archives: history

Dividend Growth Stock Overview: Connecticut Water Service, Inc.

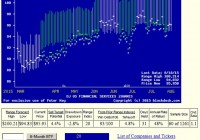
Summary CTWS provides water service to 123,000 customers in Connecticut and Maine. The water and wastewater utility segment provides over 90% of its income. The company has increased dividends since 1970. Over the last two decades, CTWS has grown its dividend at less than 2% annually. CTWS has a payout ratio of 55%, and the stock currently yields 3%. About Connecticut Water Service Connecticut Water Service, Inc. (NASDAQ: CTWS ) provides water utility services to over 123,000 customers across portions of Connecticut and Maine. The company employs 265 people and is headquartered in southeastern Connecticut. The company has 5 wholly owned subsidiaries, two of which cover Connecticut Water’s regulated utility business. The Connecticut Water Company and The Maine Water Company serve a population of about 400,000 people in their respective service areas. The Connecticut Water Company is the company’s original business, while The Maine Water Company was formerly Aqua America’s Aqua Maine subsidiary. The subsidiary was acquired at the beginning of 2012 for $35.6 million. Connecticut Water Services’ business is organized into three segments: Water Activities, Real Estate Transactions, and Services and Rentals. The Water Activities segment covers Connecticut Water’s regulated companies’ activities; the segment includes 2,100 miles of water mains, and a reservoir storage capacity of 9.4 billion gallons. The segment’s 239 active wells and 25 surface water sources is capable of supplying 176 million gallons per day. This segment provided 93% of Connecticut Water’s total net income in 2014. The Real Estate Transactions segment is responsible for disposing of Connecticut Water’s real estate holdings when they no longer serve the company’s needs. The company will sell or donate for income tax benefits the real estate holdings. This segment’s contribution to the total company’s net income is negligible; in 2014, this segment earned $50,000. The Services and Rentals segment provides contracted services to other water and wastewater utilities, like operating facilities under contract. This segment is also responsible for marketing and operating the optional service line protection program offered by Connecticut Water, which covers the cost of repairs to a broken water service line. At the end of 2014, 20,000 customers had signed up for the program in Connecticut and 2,000 had signed up in Maine. In general, this segment provides 7 – 10% of the company’s total net income; it was 7% in 2014. In 2014, Connecticut Water earned a total of $21.3 million on $94.0 million in revenues, numbers that were up 16.7% and 2.8%, respectively. The large increase in income was due an authorized increase in water rates and a reduction in income taxes. Earnings per share were up commensurately by 16.1% to $1.95. With the current annualized dividend of $1.07, the company’s current payout ratio is 54.9%. The company’s book value increased by 5% to $18.83 at the end of 2014. The company’s debt stayed flat year-over-year; the company has a debt-to-equity ratio of 84%. The company has authorized a stock repurchase program that allows for the purchase of up to 10% of the company’s total outstanding shares. The company has not purchased any shares under the program and stated in its 2014 10-K filing that it has no plans to do so. The company is a member of the Russell 2000 index and trades under the ticker symbol CTWS. Dividend and Stock Split History (click to enlarge) Connecticut Water Service has compounded dividends at about 2.7% since 2010. Connecticut Water has increased dividends since 1970. The company regularly announces increases in mid-August, with the stock going ex-dividend at the end of August. In August 2015, Connecticut Water announced a 3.9% increase in its dividend to an annualized rate of $1.07 per share. Connecticut Water should announce its 46th annual dividend increase in August 2016. Connecticut Water has grown its dividend extremely slowly over its history. For the last 20 years, the company has increased the year-over-year quarterly dividend by no more than a penny, resulting in a 5-year dividend growth rate of 2.68%. Longer term, the dividend growth rates are even slower, with 10-year and 20-year dividend growth rates of 2.20% and 1.72%, respectively. The company has split its stock twice, both times 3-for-2. The most recent stock split occurred in September 2001. Prior to that, Connecticut Water split its stock in September 1998. For each share purchased prior to September 1998, you would now have 2.25 shares of Connecticut Water stock. Over the 5 years ending on December 31, 2014, Connecticut Water Service stock appreciated at an annualized rate of 11.28%, from a split-adjusted $20.97 to $35.78. This underperformed the 13.0% compounded return of the S&P 500 and the 14.0% compounded return of the Russell 2000 Small Cap indices over the same period. Direct Purchase and Dividend Reinvestment Plans Connecticut Water Service has both direct purchase and dividend reinvestment plans. You must already be an investor in Connecticut Water Service to participate in the plans. The minimum amount for the direct purchase plan is $25. The dividend reinvestment plan allows for partial reinvestment of dividends. The plans’ fee structures are somewhat favorable for investors, with the company picking up all costs on stock purchases. However, when you sell your shares you’ll pay a sales commission of $15. In addition, if you withdraw from the dividend reinvestment plan completely, you will pay a termination fee of $35. All fees will be deducted from the stock sales proceeds. Helpful Links Connecticut Water Service’s Investor Relations Website Current quote and financial summary for Connecticut Water Service (finviz.com) Information on the direct purchase and dividend reinvestment plans for Connecticut Water Service Disclosure: I/we have no positions in any stocks mentioned, and no plans to initiate any positions within the next 72 hours. (More…) I wrote this article myself, and it expresses my own opinions. I am not receiving compensation for it. I have no business relationship with any company whose stock is mentioned in this article.

Safe 11% Annual Return With Cleco

Summary CNL offers an escape from market volatility. It also offers a double digit arbitrage yield. Here is why I own it and you might want to, too. Safety first! Deal Target Description Cleco (NYSE: CNL ) is a public utility holding company with subsidiaries that provide retail and wholesale electricity in Louisiana and Mississippi. It owns natural gas pipelines and interconnections at all generating facilities. Deal Terms On October 20, 2014, CNL announced a definitive deal to be bought by a group led by Macquarie Infrastructure and Real Assets/MIRA and British Columbia Investment Management Corporation/bcIMC, along with John Hancock Financial and others for $55.37 per share in cash. Deal Financing The deal is not conditioned upon the receipt of financing. The target is working with Goldman Sachs (NYSE: GS ) on the deal. Deal Conditions The deal is subject to normal closing conditions, including the approval of CNL shareholders, the approvals of the Louisiana Public Service Commission/LPSC and the Federal Energy Regulatory Commission/FERC, and HSR antitrust clearance. Deal Price There is currently a net spread of about $1.63 which works out to an 11% annual return if the deal closes around early December 2015 as anticipated. The deal price was at a 15% premium to CNL’s previous market price. Deal History Bruce Williamson, CNL’s CEO, is a money maker and a deal guy. So after he was named CEO in 2011, deal speculation started to build. His stock price appreciated by about 30% in his first thirty months in command. Then he began to look to sell. He has a generous package in a change of control. He gets three times his base and bonus in a deal. This was my favorite utility takeover candidate for 2014. By April 2014, Williamson definitively decided to sell. By June, he had hired GS to manage the sale process. Once the LPSC approved CNL’s formula rate plan, there was strong interest in the company from potential buyers. CNL holders approved the deal in February 2015. CFIUS cleared the deal in June 2015. FERC approved the deal in July. The FCC has approved the requisite license transfers. HSR approval was secured. The gating regulatory approval remains LPSC clearance which is expected in the fourth quarter. The hearings are scheduled for November 9-13, 2015. Deal Alternatives If the current deal falls through, alternative buyers for CNL would include American Electric Power (NYSE: AEP ), NextEra (NYSE: NEE ), CenterPoint (NYSE: CNP ), and Iberdrola SA ( OTCPK:IBDRY ). Merger Agreement Specific Performance: The parties agree that irreparable damage may occur and that the parties may not have any adequate remedy at law in the event that any of the provisions of this Agreement were not performed in accordance with their specific terms or were otherwise breached. It is accordingly agreed that, subject to Section 8.11(b) , in the event of any breach or threatened breach by any other party of any covenant or obligation contained in this Agreement, the non-breaching party shall be entitled to seek an injunction or injunctions to prevent breaches of this Agreement and to enforce specifically the terms and provisions of this Agreement, without the necessity of posting bonds or similar undertakings in connection therewith, this being in addition to any other remedy which may be available to such non-breaching party at law or in equity, including monetary damages. Material adverse effect on the Company means any change, effect, event, occurrence, development or state of facts (I) that is materially adverse to the business, financial condition, assets, liabilities, results of operations or properties of the Company and its subsidiaries, taken as a whole, but excluding any of the foregoing to the extent resulting from changes in international or national political or regulatory conditions generally (in each case, to the extent not disproportionately affecting the Company and its subsidiaries, taken as a whole, as compared to similarly situated persons), changes in the economy or the financial, commodities or securities markets in the United States or elsewhere in the world or the industry or industries in which the Company or any of its subsidiaries operates (in each case, to the extent not disproportionately affecting the Company and its subsidiaries, taken as a whole, as compared to similarly situated persons), changes or developments in national or regional wholesale or retail markets for electric power, capacity or fuel or related products (in each case, to the extent not disproportionately affecting the Company and its subsidiaries, taken as a whole, as compared to similarly situated persons), changes or developments in natural or regional electric transmission or distribution systems (in each case, to the extent not disproportionately affecting the Company and its subsidiaries, taken as a whole, as compared to similarly situated persons), any changes in law or GAAP or interpretations thereof (in each case, to the extent not disproportionately affecting the Company and its subsidiaries, taken as a whole, as compared to similarly situated persons), any weather-related or other force majeure event or outbreak or escalation of hostilities or acts of war or terrorism (in each case, to the extent not disproportionately affecting the Company and its subsidiaries, taken as a whole, as compared to similarly situated persons), the failure in and of itself of such person to meet any internal or published projections, forecasts or revenues predictions, provided that the exception in this clause (G) shall not prevent or otherwise affect a determination that any change, effect, event, occurrence, development or state of facts underlying such failure has resulted in, or contributed to, a material adverse effect on the Company, the negotiation, execution or announcement of, or compliance with, this Agreement in accordance with the terms hereof (including any adverse changes in the relationship of the Company or its subsidiaries with its employees, independent contractors, customers or suppliers resulting directly therefrom), provided that the exception in this clause (H) shall not apply to the representations and warranties contained in Section 3.01(d) to the extent that the negotiation, execution or announcement of, or compliance with, this Agreement would result in a breach or inaccuracy of the representations and warranties set forth in Section 3.01(d), or any taking of any action by the Company or its subsidiaries at the express written request of Parent, or (ii) that would prevent or materially delay the Company from performing its obligations under this Agreement or consummating the transactions contemplated hereby. Conclusion CNL offers a compelling long opportunity to capture a safe double digit annual return for the remainder of 2015. Disclosure: I am/we are long CNL. (More…) I wrote this article myself, and it expresses my own opinions. I am not receiving compensation for it (other than from Seeking Alpha). I have no business relationship with any company whose stock is mentioned in this article. Additional disclosure: Chris DeMuth Jr is a portfolio manager at Rangeley Capital. Rangeley invests with a margin of safety by buying securities at deep discounts to their intrinsic value and unlocking that value through corporate events. In order to maximize total returns for our investors, we reserve the right to make investment decisions regarding any security without further notification except where such notification is required by law.

Today’s Strong Competitive Wealth-Builder ETF Investment: IYG

Summary From a population of some 350 actively-traded, substantial, and growing ETFs this is a currently attractive addition to a portfolio whose principal objective is wealth accumulation by active investing. We daily evaluate future near-term price gain prospects for quality, market-seasoned ETFs, based on the expectations of market-makers [MMs], drawing on their insights from client order-flows. The analysis of our subject ETF’s price prospects is reinforced by parallel MM forecasts for each of the ETF’s ten largest holdings. Qualitative appraisals of the forecasts are derived from how well the MMs have foreseen subsequent price behaviors following prior forecasts similar to today’s. Size of prospective gains, odds of winning transactions, worst-case price drawdowns, and marketability measures are all taken into account. Today’s most attractive ETF Is the iShares US Financial Services ETF (NYSEARCA: IYG ) . The investment seeks to track the investment results of an index composed of U.S. equities in the financial services sector. The fund generally invests at least 90% of its assets in securities of the underlying index and in depositary receipts representing securities of the underlying index. It seeks to track the investment results of the Dow Jones U.S. Financial Services Index (the “underlying index”), which measures the performance of the financial services sector of the U.S. equity market. It is a subset of the Dow Jones U.S. Financials Index. The fund is non-diversified. (from Yahoo.Finance.ETF.Profile) The fund currently holds assets of $774 million and has had a YTD price return of +5.49%. Its average daily trading volume of 107,208 produces a complete asset turnover calculation in 75 days at its current price of $95.95. Behavioral analysis of market-maker hedging actions while providing market liquidity for volume block trades in the ETF by interested major investment funds has produced the recent past (6 month) daily history of implied price range forecasts pictured in Figure 1. Figure 1 (used with permission) The vertical lines of Figure 1 are a visual history of forward-looking expectations of coming prices for the subject ETF. They are NOT a backward-in-time look at actual daily price ranges, but the heavy dot in each range is the ending market quote of the day the forecast was made. What is important in the picture is the balance of upside prospects in comparison to downside concerns. That ratio is expressed in the Range Index [RI], whose number tells what percentage of the whole range lies below the then current price. Today’s Range Index is used to evaluate how well prior forecasts of similar RIs for this ETF have previously worked out. The size of that historic sample is given near the right-hand end of the data line below the picture. The current RI’s size in relation to all available RIs of the past 5 years is indicated in the small blue thumbnail distribution at the bottom of Figure 1. The first items in the data line are current information: The current high and low of the forecast range, and the percent change from the market quote to the top of the range, as a sell target. The Range Index is of the current forecast. Other items of data are all derived from the history of prior forecasts. They stem from applying a T ime- E fficient R isk M anagement D iscipline to hypothetical holdings initiated by the MM forecasts. That discipline requires a next-day closing price cost position be held no longer than 63 market days (3 months) unless first encountered by a market close equal to or above the sell target. The net payoffs are the cumulative average simple percent gains of all such forecast positions, including losses. Days held are average market rather than calendar days held in the sample positions. Drawdown exposure indicates the typical worst-case price experience during those holding periods. Win odds tells what percentage proportion of the sample recovered from the drawdowns to produce a gain. The cred(ibility) ratio compares the sell target prospect with the historic net payoff experiences. Figure 2 provides a longer-time perspective by drawing a once-a week look from the Figure 1 source forecasts, back over two years. Figure 2 (used with permission) What does this ETF hold, causing such price expectations? Figure 3 is a list of securities held by the subject ETF, indicating its concentration in the top ten largest holdings, and their percentage of the ETF’s total value. Figure 3 Source: Yahoo Finance IYG Concentrates 60% of its assets in its top ten commitments. This provides a responsive measure of the action of market prices of stocks in this essential sector. The major holdings are all established, dominant participants in the financial services industry. Figure 4 is a table of data lines similar to that contained in Figure 1, for each of the top ten holdings of IYG. For convenience, the IYG data itself is included. Figure 4 (click to enlarge) Column (5) contains the upside price change forecasts between current market prices (4) and the upper limit of prices (2), regarded by MMs as being worth paying for protection from adverse price change. The average of +7.2% of the top ten IYG holdings is well above the market-average proxy of SPY of +5.3%. Diversification of IYG’s other 40% of holdings damps its overall upside (as MMs see it) to only +4.4%. But in the same stroke the risk side of the equation in (6) for IYG is brought down to worst-case price drawdowns of -2.8%, below the defensive market-tracking ETF SPY norm of -3.2%. In an environment many consider imbued with high market risk, IYG may provide a very attractive balance. The ability of IYG holdings to recover from those worst-case drawdowns and achieve profits (8) occurred in 93% of experiences. The equity population only recovered less than two thirds of the time, and while the SPY experiences were more consistent, the achieved gains were much smaller. SPY has had only +3.5% gains previously from like forecasts of +5.3%. Another qualitative consideration is the credibility of IYG after previous forecasts like today’s. Its net average price change gain (column 9) has been 1.1 times the size of the upside forecast average, +4.8% compared to +4.4%. The equity population’s actual price gain achievement, net of losses has been a pitiful +3.2% compared to promises of 13.5%. Conclusion IYG provides attractive forecast price gains, supported by its equally appealing largest holdings. Both the ETF and many of its major holdings offer very attractive prospects in near-term price behaviors, demonstrated by previous experiences following prior similar forecasts by market makers. But it may be considered a defensive commitment in the face of widespread anticipation of further market weakness. A more constructive strategy would be to seek out individual stock opportunities offering odds-on achievement of low double-digit price gains where past similar forecasts encountered only small worst-case price drawdowns during their relatively short holding periods en route to sell targets. The blue summary row of Figure 3 labeled “20 best odds forecasts” tells what the current top-ranked wealth-building opportunities are offering, as a comparative competitive norm. YTD in 2015, 2062 of these 20-a-day list members have reached closeouts in an average of 2-month holding periods, providing a +30% annual rate of average price-change gains. Disclosure: I/we have no positions in any stocks mentioned, and no plans to initiate any positions within the next 72 hours. (More…) I wrote this article myself, and it expresses my own opinions. I am not receiving compensation for it (other than from Seeking Alpha). I have no business relationship with any company whose stock is mentioned in this article.