Staying Ahead Of The Curve: A Look At The Consumer Discretionary Sector
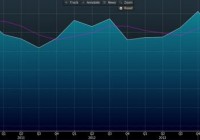
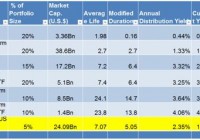
Summary By monitoring economic and price momentum changes, investors can stay ahead of the curve. The U.S. economy is growing at trend pace, the labor market continues to improve and the borrowing costs remain low. From a total return perspective the Consumer Discretionary emerged as a sector leader. As such investors should consider a tactical position in the sector through the ETF XLY. The first time I fell in love with mathematics was during an Additional Mathematics class. It was my first interaction with Calculus, and I had to determine the turning points of quadratic and other polynomial equations. These tasks could be found through the measuring of these equations’ or functions’ change as the inputs change, known to mathematicians as the 1st derivative. For weeks upon end the class would receive assignments from our teacher, Mr. Roop, perhaps the best mathematics teacher in the country. To this day I can still calculate the turning points of quadratic and polynomial equations, and many other topics under that curriculum. I owe it to him. Almost a decade after I was in Mr. Roop’s class, I came across the Efficient Frontier; this is the place that investors want to find. The optimal point where the risk ratio is at its maximum, the turning point of the curve – its first derivative. Chart 1 – Efficient Frontier Source: New Trading Systems and Methods Although it is not high school calculus, investors should be aware of the changing financial landscape and constantly searching for that optimal point. One strategy of doing this is fusing economic trends with price momentum. By observing economic trends in the U.S. as well as the sector performance in the S&P 500 Index, investors can stay ahead of the curve by monitoring the changes. One such change is in the performance of the Consumer Discretionary sector. With low borrowing costs, improving labor market data and positive economic growth, a tactical position in the Consumer Discretionary Sector for 2015 can place investors’ portfolios ahead of the respective benchmark’s curve. Investors seeking a tactical position in the Consumer Discretionary sector should consider the ETF (NYSEARCA: XLY ), the Consumer Discretionary Select Sector SPDR Fund. Economic Activity Revised figures show that U.S. GDP grew 2.4% year over year in the 4th quarter of 2014. This rate is equal to the 4-quarter moving average of 2.4% so the U.S. is still growing at pace. Consumer spending was strong as real PCE rose 4.3% versus 3.2% in the previous quarter. This was the strongest quarterly increase in the post-financial crisis era. Residential investment improved given the loosening of mortgage credit and this trend is likely to continue. Chart 2 – U.S. GDP Growth (Year-Over-Year %) as at December 2014 (click to enlarge) Source: Bloomberg U.S. CPI fell 0.1% year over year as at January 2015. This was as a result of energy costs which slumped 9.7% in January, the biggest drop since November 2008, led by an 18.7% decline in gasoline prices which was also the largest in 6 years. What was more striking was the U.S. core CPI. U.S. core CPI held at 1.6%, giving the Fed an impetus to raise rates as the slump in energy has not filtered to other goods and services. Thus, as energy prices rebound, both CPI and core CPI will increase, bringing the Fed closer to raising rates and indirectly strengthening the U.S. Dollar. Chart 3 – U.S. CPI (Year-Over-Year %) as at January 2015 (click to enlarge) Source: Bloomberg Chart 4 – U.S. Core CPI (Year-Over-Year %) as at January 2015 (click to enlarge) Source: Bloomberg The U.S. labor market is showing signs of slack-removal. Employers added 295,000 workers to payrolls in February. The U.S. unemployment rate dropped to 5.5%, the lowest in almost 7 years. Hourly earnings also increased. Fed officials will score this data as positive as they continue to deliberate raising rates. Chart 5 – U.S. Unemployment rate as at February 2015 (click to enlarge) Source: Bloomberg The tables and charts below show the Fed projections as at December 2014. If the trend continues to align with projections, the Fed may be inclined to raise rates by the 3rd quarter of 2015. Table 1- Economic Projections of Federal Reserve Board Members and Federal Reserve Bank Presidents, December 2014 (click to enlarge) Source: Federal Reserve Chart 6-8 – Central Tendencies Of Economic Projections, 2014-2017 And Over The Longer Run Source: Federal Reserve Consumer Discretionary Sector Overview New distribution networks for the movies and entertainment industry continue to emerge across digital platforms like online streaming, electronic sell-through (EST), video on demand (VOD), and mobile devices (smartphones, tablets, etc). The music industry will also benefit from digital music sales through iTunes, Amazon (NASDAQ: AMZN ), Pandora (NYSE: P ), etc. Furthermore there seems to be a merging of recorded music, concert promotion, artist management and ticketing. Content providers are seen taking advantage of convergence of content, technology and services, with Netflix (NASDAQ: NFLX ), Amazon ( AMZN ) and Hulu becoming popular streaming video destinations. The control for the living room continues with the likes of Apple ( OTC:APPL ) TV, Roku, Google’s (NASDAQ: GOOG ) (NASDAQ: GOOGL ) Chromecast and others, giving consumers a seamlessly integrated experience across video, data and voice services. Also online merchants provide consumers with a strong combination of convenience, selection, information and value compared to off-line competitors. Furthermore advancements in technology have made e-commerce transactions easier to complete and more reliable and secure, helping to drive sales. The U.S. housing market is expected to improve for 2015 as the economy and labor market grows. U.S. home ownership levels will drive market growth. Homeowners tend to spend more to maintain and improve homes than do renters. The U.S. Census Bureau reported that in the 4th quarter of 2014, home ownership stood at 64%. Currently the S&P 500 Consumer Discretionary Sector Index’s P/E is standing at 21.53 times, which is relatively above the 1-Year, 3-Year and 5-Year averages, which signals that the sector is historically overvalued. Similarly the S&P 500 Index is also trading above its historical average P/Es, with its current P/E being at 18.30 times, which is above the 1-Year, 3-Year and 5-Year averages. This is as a result of the overall interest rate environment. With U.S. yields near historical lows, investors are prepared to pay a premium for U.S. equities, elevating the current P/E of the Consumer Discretionary sector and the S&P 500 Index overall. Table 2- Current P/Es Vs Historical Averages as at 13 th March 2015 Source: Bloomberg Table 3- XLY Dividend Yield Vs S&P 500 as at 13 th March 2015 Source: Bloomberg Investors should look at XLY for growth in their respective portfolios given the underperformance in dividend yield relative to the S&P 500 Index Fund (NYSEARCA: SPY ). Table 4- Consumer Discretionary Sector Key Fundamental Metrics as at 13 th March 2015 (click to enlarge) Source: Bloomberg Price Momentum The theory behind this relative sector rotation model is to take advantage of the price momentum in the S&P 500. By taking overweight positions in sector leaders and underweight positions in the lagging sectors, the model should outperform the S&P 500 over time. Thus it is critical to note the changes in sector leadership. The table below shows the total returns of the different sectors over different time buckets. Sectors are identified as leaders when they outperform 3 or more times over the various time frames. Also sectors are identified as laggards when they underperform 3 or more times over the various time frames. The sectors colored in green are leaders, while the ones colored in red are laggards and those in blue are neutral. Table 5- Total Returns of the S&P 500 Sectors over Various Time Frames as at March 13 th 2014 Source: Bloomberg Here we see the Consumer Discretionary Sector is playing a leadership role as it is identified in green. Conclusion With the borrowing costs and inflation still low while economic growth and the labor market growing at a positive steady pace, the U.S. consumer is well positioned. The trends are compounded with shifts in the price momentum in the consumer discretionary sector. Disclosure: The author has no positions in any stocks mentioned, and no plans to initiate any positions within the next 72 hours. (More…) The author wrote this article themselves, and it expresses their own opinions. The author is not receiving compensation for it (other than from Seeking Alpha). The author has no business relationship with any company whose stock is mentioned in this article.