Tag Archives: fbiox

A Fund Selection Case Study

Recently, we received an inquiry as to why we did not use more Fidelity funds for the 401(k) plans that we manage. Specifically, we were asked why we did not include the Fidelity Select Biotech Portfolio (MUTF: FBIOX ), which has done well recently. We’ve written about how to select securities , but in this article, we are going to apply those principles to the process of selecting a specific fund for a specific sector of the economy . The decision is which fund we should select to represent healthcare. We use the Vanguard Health Care Fund (MUTF: VGHAX ), which is comprised of 82 different stocks. FBIOX is made up of 262 holdings. This measure would favor the Fidelity fund. Having more holdings is a sign of diversification for the fund. There is no such thing as over diversified , more holdings is better. For both of these funds, the top ten holdings of each fund represent 41% of the fund’s assets. This is not as diversified as it could be, but they are comparable in this way. Foreign stocks represent about 10% of FBIOX and about 20% of VGHAX. Neither of these percentages matter to our definition of the Healthcare sector, but if we were specifically targeting or avoiding foreign stocks with the sector, it would be relevant. Both funds have a 14-year track record. Fourteen years may seem long but is still an insufficient time period for long-term investing statistics. Even the S&P 500 is flat or down for a decade about 6% of the time. The fact that both healthcare funds more than doubled the return of the S&P 500 over this time period is not an indication that they will perform this way going forward. With those caveats in mind, here is how each fund performed. VGHAX had a better return over the fund’s histories. The return was both smoother and superior. A $10,000 investment in VGHAX grew to $45,335 vs. $43,435 for the Fidelity fund. Click to enlarge We specifically do not use how many Morningstar stars a fund has received. Morningstar themselves have done the analysis to show that selecting funds with low expense ratios is a better method of predicting superior future performance. The Vanguard fund has an expense ratio of 0.29% while the Fidelity fund has an expense ratio of 0.74%. This 0.45% difference in expense ratio is a hurdle that the Fidelity fund has to work to overcome. Yet when you compare the average annualized return of the two funds, it appears that the Fidelity fund has simply underperformed the Vanguard fund by the difference in expense ratios. Click to enlarge A final measurement is to see if the Vanguard fund had a superior return by taking additional risks. Risk is usually measured by measuring the standard deviation of annual returns. For the Vanguard fund, the standard deviation of its annual returns was 15.34% while the Fidelity fund’s standard deviation was 22.75%. Click to enlarge The Fidelity fund’s greater volatility is probably a result of having a larger percentage of its investments in mid and small-cap funds. The Fidelity fund has 47% of its holdings in large cap funds while the Vanguard fund has 89% in large cap. Mid and small-cap companies exhibit greater volatility even when you are diversified among hundreds of smaller holdings. Even though these two funds have very similar long-term returns, in the short term, they can be very different. Every month the delta between the return of each fund can be 10% or more in either direction. Here is a graph showing how much VGHAX outperformed or underperformed FBIOX each month. Click to enlarge We do look at a fund ranking system put out by the Center for Fiduciary Studies at fi360.com . Fi360 ranks funds from zero (best) to 100 (worst) within each sector. VGHAX has a three-year average ranking of 10, and FBIOX has 26. One of the fi360 criteria is that the fund’s Sharpe ratio must score in the top 50% of its peer group. Sharpe ratio is a measure of the historical return per amount of risk taken. The Fidelity fund scores poorly for having taken additional risk but not achieve a sufficient return to justify the risk taken. Other criterion used by fi360 include having 80% of its assets actually being invested in the target sector or style, a three-year track history, 75-million under management, and most importantly a relatively low expense ratio. These criteria provide a simple short example of how we go about fund selection and why we selected VGHAS over FBIOX for the 401(k) plans we manage.

Best Performing Fidelity Mutual Funds Of Q2 2015

Performance wise, markets had a very tough first half of 2015 as the second quarter could do little to offset the concerns set up in the first quarter. Only four of the mutual fund categories posted above a 10% gain in the first half. Also, just 41% of mutual funds could manage to finish in the green in the second quarter. This is less than half of the 81% gains scored by mutual funds in the first quarter. These losses however owed a lot to the selloff on the eve of the quarter’s end. Amid the dismal numbers, Fidelity Funds comparatively had a decent second quarter with a top gain of 11.6% in the second quarter. Of the 950 funds under the study, 504 funds had positive return. Though a large number of funds ended in the red, only 22 funds lost more than 5%. (Note: This number includes same funds of different classes) Category Returns The 11.6% gain from the Fidelity China Region Fund (MUTF: FHKCX ) helped Fidelity beat other prominent fund families like Vanguard, BlackRock and American Funds to mention a few. The ones ahead of Fidelity were ProFunds, Matthews International, Allianz and Invesco. Except for one, all funds who gained more than FHKCX belonged to the China category. China had a strong performance in the second quarter as well, before hitting a sudden slump in late June. As China’s Bull Run ended momentarily, the government actions were swift to boost the markets. While Japan scored the most gains during the first half of 2015, healthcare followed next, which is shown by Fidelity’s healthcare fund notching the number 2 spot. However, before we look into the top 10 Fidelity gainers in second quarter, let’s look at some other developments. Fund Family: Fidelity Investments Fidelity Investments is one of the largest mutual fund companies in the world having $1,814.3 billion of mutual fund assets under management (as of Mar 31, 2015). It has a wide variety of mutual funds spanning across a varied spectrum of sectors. The number of mutual funds managed by Fidelity stood at 576 as of Mar 31, 2015. Below we present other key numbers: According to Morningstar data, Fidelity’s total return in 2015 as of Jun 30 is 3.7%, beating the category average of 2.7%. Of the total assets, 48.1% were invested in domestic stocks, 10.5% in international stock, 14.3% in taxable bond and about 2% in municipal bond. About 94.5% of assets carried no sales load. Q2 Trends In the second quarter, Fidelity notes that there was slow global growth but developed economies witnessed better traction than the emerging ones. While the US and Europe were steady, commodity prices stabilized and deflation pressures eased. Deflation fears eased based on volatile global economic progress and inflated bond yields. Fidelity says: “We continue to expect a moderately benign environment of modest cyclical improvement led by developed economies, though higher market volatility is likely and inflationary and deflationary risks remain.” As deflation fears eased, government bond yields in many developed countries went up in the second quarter. The sudden rise in Europe came after yields had dropped to multi-year lows in first quarter. Second quarter handed most fixed-income categories losses. Equities posted modest gains and non-US equities had better returns over the US counterparts. As for the economies, Fidelity notes “Europe continues to gain traction in its mid-cycle reacceleration, the U.S. is solidly mid-cycle, and Japan has entered a tepid early cycle along with monetary stimulus and a weaker yen. China has slipped into a growth recession.” Top 15 Fidelity Funds of Q2 2015 Below we present the top 15 Fidelity funds with best returns of Q2 2015: (click to enlarge) Note: The list excludes the same funds with different classes, and institutional funds have been excluded. If we compare the list with the first quarter performance, only four funds made it to the second quarter top performing list. These are the Fidelity Select Biotechnology (MUTF: FBIOX ), the Fidelity Adv Biotechnology A (MUTF: FBTAX ), the Fidelity Japan Smaller Companies (MUTF: FJSCX ) and the Fidelity Small Cap Growth (MUTF: FCPGX ). While FCPGX carries a Zacks Mutual Fund Rank #1 (Strong Buy) and FBIOX has a Zacks Mutual Fund Rank #2 (Buy), FJSCX and FBTAX hold Zacks Mutual Fund Rank #4 (Sell) and Zacks Mutual Fund Rank #5 (Strong Sell). The quarterly gains are also lower in comparison to the first quarter. The best gain during the first quarter was 16%, while the lowest then was 6.5%. The lowest gain, scored by the Fidelity Overseas Fund (MUTF: FOSFX ), is 3.6%. A simple average calculation shows that the average gain of these top 15 funds in Q2 is 5.9%. It is significantly lower than average gain of 9.6% in first quarter. The other trend we noticed is that Healthcare, Foreign and to an extent Small Cap dominated the list of top 15 Fidelity funds. This is apt given that overseas funds category in general had a profitable second quarter. Healthcare has continued the momentum that it has been enjoying for past quarters. Small Growth does feature in Morningstar’s top 10 category performers, thus helping two of Fidelity’s funds get a place in top 15. These are the Fidelity Adv Global Cap App A (MUTF: FGEAX ) and the Fidelity Small Cap Growth ( FCPGX ). Among the other favorably-ranked funds in this list are the Fidelity China Region Fund, the Fidelity Select Medical Delivery (MUTF: FSHCX ), the Fidelity International Small Cap (MUTF: FISMX ), the Fidelity Adv International Small Cap A (MUTF: FIASX ), the Fidelity Intl Small Cap Opps (MUTF: FSCOX ), the Fidelity Select Multimedia (MUTF: FBMPX ), the Fidelity Adv Overseas Fund A (MUTF: FAOAX ) and the Fidelity Overseas Fund ( FOSFX ). While FHKCX, FSCOX, FAOAX and FOSFX carry a Zacks Mutual Fund Rank #1, FSHCX, FISMX, FIASX and FBMPX hold a Zacks Mutual Fund Rank #2. Link to the original post on Zacks.com

Top 10 Mutual Fund Performers Of 1H 2015

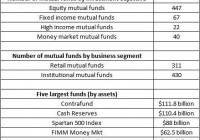
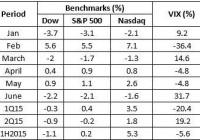
The first half performance of mutual funds cannot be termed as very strong. Only four of the mutual fund categories analyzed posted above a 10% gain in the first half. The broader market performance also compares unfavorably with the same periods in 2014 and 2013. Amid high volatility, the Dow failed to end in the green in 1H 2015, while the S&P 500 managed to gain just 0.2%. The Dow was the only benchmark in the first quarter to end in the red, but S&P 500 joined the blue-chip index in negative territory in the second quarter. The S&P 500 thus ended its nine-quarter winning trend, but the Nasdaq managed to extend its winning streak to 10 quarters and hit an all-time high. What Happened in First Half of 2015? The year started with concerns related to lower global growth projections, a slump in oil prices, strengthening of the dollar and apprehensions about the timing of the Fed interest rate hike. Amid this, the GDP data had been of little help. Beginning with the harsh winter and dismal releases, economic data has been mixed. Meanwhile, an increase in bond yields remained a cause for concern through May. By the first week of May, the yield on the benchmark U.S. 10-year note touched its highest level for 2015. However, recently, the retail and housing sector data have shown strength. The Fed officials meanwhile signaled a hike in interest rates, though at a slower-than-expected pace. The major headwind for the market is the drama in Greece. Greek debt negotiations have guided markets right from the beginning of 2015. On the last day of 1H 2015, Greece defaulted on IMF repayments despite submitting a fresh two-year aid proposal to its creditors. Synopsis of Benchmark & Fund Category Performance Below we present the performance of the key benchmarks, i.e., the Dow Jones Industrial Average, Standard & Poor’s 500, Nasdaq Composite Index, and the fear-gauge CBOE Volatility Index (VIX). Synopsis of YTD Fund Category Performance as evident from the chart, volatility has been very pronounced. Losses in January was followed by gains in Feb, and then ended in the red again in March. Though markets managed small gains in April and May, they were back to the negative zone in June. Focusing on June, the losses for the Dow and S&P 500 were the largest since January. Also, all three benchmarks ended in the red in June, repeating the event last seen in March. Except February, benchmarks have failed to post solid gains. In fact, it was February’s robust gains that had helped offset the losses in the first quarter and reduced the loss margin for 1H 2015. Except for the Nasdaq, we do not have a benchmark performance to be proud of. Below we present the top 15 fund categories for the first half of 2015: Source: Morningstar The performance chart clearly reveals the domination of the non-US fund categories. Apart from the Healthcare funds, there are no US categories in the top 5. Small growth fund category manages to snatch a place in the top 10 with gains of about 7.9%. It was fairly natural for the Japan Stock fund category to clinch the top spot given that Nikkei has hit an 18-year high. China too had soared this year, before hitting a rough patch recently. Key Events Coming to the key events now, earnings, data on GDP, nonfarm payroll, retail, and housing were the primary factors on the domestic front. Along with this, guessing the timing of the first rate hike has also swung markets. For international events, it has been predominantly the Greek drama with some inputs from China and Japan. Earnings Affected by Strong Dollar The US dollar achieved a 12-year high and had a meteoric rise against the euro early this year. However, the stronger dollar sparked concerns about the multinationals’ earnings numbers, as a stronger dollar will impact exports. This was proved true, or at least the ‘dollar scapegoating’ was a theme in the reading of the first quarter results. The large-cap S&P 500 companies earn about 40% of their revenues from outside the US. Total first quarter earnings for the 498 S&P 500 members were up 2.4% on lower revenues of 3.3%. Only 62% could beat EPS estimates and only 42.4% outperformed revenue expectations. GDP Advance estimates in January revealed that fourth quarter GDP increased at an annual rate of 2.6%, less than the consensus estimate of an increase by 3.6%. Eventually, the third estimate showed GDP increased at an annual rate of 2.2%, less than the consensus estimate of an increase by 2.4%. The advance estimate for the first quarter was again dismal. GDP was forecasted to have improved by 0.2%, less than the consensus estimate of an increase by 1%. The second estimate showed contraction as GDP was estimated to have shrunk 0.7%. However, this was narrower than the consensus estimate of a 0.8% decline. As for the latest data, the first quarter GDP reading showed that the economy contracted in the first quarter at a slower pace than previously estimated. According to the “third estimate,” GDP contracted at an annual rate of 0.2% in the first quarter. Employment Data Nonfarm payroll data has been mostly encouraging. The U.S. economy created 257,000 new jobs in January, the 11th consecutive month in which the economy generated more than 200,000 jobs, its longest such stretch since 1994. The unemployment rate went down to a six and a half year low of 5.5% in February. However in March, 126,000 jobs were added, less than the consensus estimate of 247,000. Also, job additions fell below 200,000, bringing an end to the unbroken run of 12 such successive monthly gains. March’s figure was later revised down to 85,000. In May, the US economy recorded the largest job additions since Dec. 2014. A total of 280,000 jobs were created in May. Fed’s Rate Hike A continuous market mover is the guessing game of the first rate hike. The nature of mixed economic data had somewhat restricted the Fed from giving a clear indication on the timing of the first rate hike. Also, there has been contradictory views, adding to volatility and shift in investor sentiment. Minutes from the FOMC’s April 28-29 meeting had stated that officials opined a rate hike in June was “unlikely” as they remained concerned about weak economic growth in the first quarter. However, now, the Federal Reserve signaled it will hike interest rates at a slower-than-expected pace. Fed officials said that the improving U.S. economy is strong enough to withstand one or two rate hikes this year. However, officials kept short-term interest rates unchanged in the FOMC policy meeting. Fed members haven’t yet decided when to raise rates this year as the decision will depend on how the economy evolves. Greece Crisis This has been the biggest international event driving the markets this year. Negotiations between Greece and its creditors have continued through the year, but on the final day of the first half of 2015, the country defaulted on its debt repayment. Looking back, Greece’s finance minister Yanis Varoufakis in January had rejected the country’s extended bailout program. February had begun on a tense note after the ECB cancelled its acceptance of junk-rated Greek government debts as security for regular central bank loans. Later in the month, Germany dismissed Greece’s plea for bridge funding until the end of May. Ultimately, Greece’s finance minister, Yanis Varoufakis and other Eurozone’s officials struck a deal regarding Greece’s bailout program. The Grexit concerns intensified again in May and continued to impact. Lingering uncertainty over striking a deal between Greece and its creditors dampened sentiment during the first week of June. Gains for stocks were limited during the second week due to the IMF halting negotiations with Greece. Eurozone finance ministers failed to strike a deal with Greece over the country’s bailout program during the third week as well. Uncertainty over Greece’s bailout program led to daily deposit outflow of around one billion euros, which eventually led to the ECB approving an emergency loan to Greece’s banking system. Breakdown in cash-for-reform talks between Greece and its lenders over the last weekend left the country teetering on the brink. Finally now, Greece defaulted on IMF repayments despite submitting fresh two-year aid proposal to its creditors. The latest update is that Greece is appealing to eurozone partners to ‘keep it afloat.’ Top 10 Mutual Fund Performers in 1H 2015 Below, we present the year-to-date best-performing mutual funds. However, we only have considered those funds that have a minimum initial investment within $5000 and net assets over $50 million. Six of these 10 mutual funds carry a favorable Zacks Mutual Fund Rank. While Fidelity China Region Fund (MUTF: FHKCX ) and VALIC Co I Health Sciences Fund (MUTF: VCHSX ) hold a Zacks Mutual Fund Rank #1 (Strong Buy), funds including Matthews China Dividend Fund (MUTF: MCDFX ), Fidelity Select Biotechnology (MUTF: FBIOX ) and T. Rowe Price Health Sciences (MUTF: PRHSX ) hold a Zacks Mutual Fund Rank #2 (Buy). However, Rydex Biotechnology A (MUTF: RYBOX ), Oberweis China Opportunities (MUTF: OBCHX ) and Invesco China A (MUTF: AACFX ) carry a Zacks Mutual Fund Rank #4 (Sell). Separately, Fidelity Adv Biotechnology A (MUTF: FBTAX ) holds a Zacks Mutual Fund Rank #5 (Strong Sell). Meanwhile, with net assets below $50 million, Buy-ranked Rydex Japan 2x Strategy A (MUTF: RYJSX ) has gained 27.7%. This would have thus ranked second in the top-15 list. Going Forward Greece will continue to affect mood and everyone want a positive progress. The rate hike too is most likely to come in the second half and this will guide markets. GDP will most likely turn out to be positive hereafter and the labor data has already shown strength. Retail will further add strength in the concluding months when holiday season heats up. Housing market has already shown signs of a rebound, and except for a temporary glitch, they may not trend south. Therefore, let’s hope for a profitable second half now. Original Post