Tag Archives: european

The Greek Share Market: Poised For Significant Gains, After The Situation Calms Down
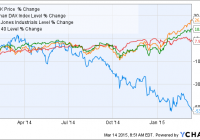
Summary The Global X FTSE Greece 20 ETF has declined by more than 50% since the beginning of 2014. The Greek government seems to understand the negative impacts of the potential grexit and they will have to fulfill the conditions of their Eurozone partners in the end. The Greek share market will grow significantly after the current problems are resolved. The growth will be strengthened by the European QE. The Greek share market represented by the Global X FTSE Greece 20 ETF (NYSEARCA: GREK ) has declined by more than 50% since the beginning of 2014. A major part of the decline happened in the second half of 2014 and in 2015 and it was caused by the renewed concerns about the potential grexit. The GREK share price behaved in line with the major markets (chart below) from the beginning. The problems started during the summer months and culminated in December and January when a political crisis led to early elections. The elections were won by Syriza, a party with a strong and loud anti-austerity rhetoric. Their way to power was paved by refusing the austerity measures and by a lot of unrealistic promises to the electorate. The new Greek government, led by prime minister Alexis Tsipras, initially demanded another debt writedown as well as a renegotiation of terms of the bailout program. After four weeks full of furious negotiations and a free fall of the Greek financial markets, the Greek government promised reforms, promised that it will not introduce any unilateral measures that would negatively impact the fiscal targets set by the “troika” and it declared its intention to fulfill its financial obligations. As a result, the bailout program should be extended by another four months. But a new list of reforms must be accepted by the Eurozone finance ministers before another financial aid disbursement. The proposed reforms were rejected by the Eurozone partners on March 9 and there is a threat of a Greek default as soon as this month. Although the initial reaction of the Greek representatives was highly negative, ranging from demands for German war reparations to threats of flooding Europe with immigrants. But on Friday, Tsipras reassured that Greece will hold its word given in February. It is more evidence that the Greek government realizes the painful consequences of the potential grexit. All the screaming and kicking around is just theatre for the Greek electorate. The grexit and the Greek default would lead to an immediate decline of the purchasing power of Greek citizens. The unemployment rate would grow above the current 25% level and the bank sector would be on the brink of a total collapse. Any chances of the current Greek government for a future re-election would drop to values close to zero. Yes, the grexit could be positive for Greece from a long term point of view. But the long term positives are not a sure thing. The only sure thing is huge pain in the short term. The most probable scenario is that the Greek government will keep on screaming and kicking, so that it can show their voters that they want to keep their promises and they fight for Greece, but they will surrender in the end in order to avoid the grexit and the responsibility for it. The Eurozone partners may make some minor compromises in order to give Syriza an opportunity to show their voters some “success”. But any major reliefs are highly improbable. The economy of the Eurozone is stronger than in 2012 and what is more important, the European financial sector is much better prepared for a potential grexit. The grexit is a much bigger threat for Greece than for the Eurozone today. As I wrote above, I expect that the situation will calm down and Greece will stay in the Eurozone. This is why I see a huge investment opportunity in Greek shares. As the chart below shows, GREK increased rapidly after its bottom in May 2012. It grew from $8.85 on June 1, 2012, to $18.80 on October 22, 2012. That’s more than 100% in less than five months. Yes, the historical results are no guarantee of future results, but history tends to repeat itself. Moreover, there is another powerful card in play this time. The European QE. The QEs led to inflation of a share market bubble in the USA. The same process has started in Europe now. And a lot of investors will direct their money into cheap Greek shares, after the situation around Greece calms down a little. I admit, I have no idea where the bottom will be and when it will come. It is possible that GREK will retest the 2012 lows in the coming weeks and it is possible that the bottom is somewhere near the current price level. Everything will depend on the progress of the Eurozone – Greece negotiations. The longer the negotiations last, the more the market’s nervousness will grow and the lower GREK will fall. The best solution is to wait until any kind of solution is reached and initiate a position in GREK. It may mean buying shares 10% or 20% above the bottom, but there will likely still be a huge upside remaining. Conclusion Although the Greek government is very loud and very aggressive, Tsipras seems to realize the negative impacts of the grexit on Greece and the future political careers of him and his party. I believe that Greece will surrender and fulfill the demands of its partners. In this case we can expect a huge increase of the GREK share price. It increased by more than 100% in less than five months, back in 2012. Similar gains are possible this time, given the supporting effects of the European QE. The best way to play this situation is to wait until the current complications between Greece and its Eurozone partners are resolved and initiate a long position. It may mean losing some initial gains of the bull run, but there should be still more than enough profits left. Disclosure: The author has no positions in any stocks mentioned, and no plans to initiate any positions within the next 72 hours. (More…) The author wrote this article themselves, and it expresses their own opinions. The author is not receiving compensation for it (other than from Seeking Alpha). The author has no business relationship with any company whose stock is mentioned in this article.
20% Dividend Raise And Recent Pullback Make My Favorite Utility Northwestern Corp. Attractive

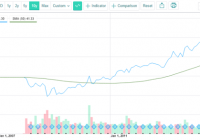
NWE raised its dividend 20% for Q1 2015 to $0.48 per common share (3.67% annually). Q4 2014 adjusted earnings were $2.68 per share (at the midpoint of guidance of $2.60-$2.75) a +7.2% improvement over Q4 2013. Total revenues were about $312.95 million. This was a miss of -$37.14 million. Revenues were down year over year about -1.9%. Northwestern Corp. (NYSE: NWE ) does business under the name Northwestern Energy. On February 15, 2002 Northwestern Corp. acquired the energy distribution and transmission business of Montana Power to form Northwestern Energy (still Northwestern Corp. though). It is a leading energy delivery company with business in Montana, South Dakota, Nebraska, and Wyoming, especially the first two states. It recently raised its dividend by 20% to $0.48 per common share per quarter for a 3.67% annual yield. The long term chart of NWE below shows it to be in a strong upward trend long term. (click to enlarge) Essentially NWE has gone straight upward since the low of the Great Recession. Perhaps as significantly, it had recovered fully from the Great Recession by April 1, 2010. Such stalwarts as Chevron and Johnson & Johnson took much longer — until early 2011 and late 2012 respectively. Even stalwart utility companies such as Southern Company (NYSE: SO ) and Consolidated Edison (NYSE: ED ) took until early 2011 to recover to their 2007 highs. NWE has a past as an outperformer; and its future will likely be equally as bright. To understand the latest stock price movements, it may be best to look at the charts of the 10 year US Treasury Note yield and the one year chart of NWE . (click to enlarge) The yellow line in the NWE chart above demarks January 30, 2015, which was the recent yield nadir for the 10 year US Treasury Note. As the yield for the 10 year US Treasury Note rose from 1.64% on January 30, 2015 to 2.24% on March 6, 2015, the price of NWE stock fell. This is the normal scenario for utilities when interest rates rise because the utilities’ dividend rates are normally remaining unchanged. This high correlation also likely tells investors that this is a good time to buy NWE (and utilities in general), if you believe the yield on the 10 year US Treasury Note is resuming its downtrend. There are many reasons to believe this: Most EU bonds have been trending downward due to the €1.1 trillion ECB QE program in 2015. Many bonds that are generally viewed as riskier and less stable than US Treasuries currently have much lower yields (and are much more expensive) than US Treasuries. For example, the Spanish 10 year bond yield is 1.15% and the Italian 10 year bond yield is 1.13% . These low yields on “riskier” bonds should push the yields of the “less risky” 10 year US Treasury bonds downward. The 10 year US Treasury Note yield is 2.12% as of this writing March 13, 2015. The USD has risen dramatically against the Euro and other currencies in the last year. For instance, the Euro has fallen from 1.39 USD per Euro on May 6, 2014 to 1.06 USD per Euro as of the close on March 12, 2015 (almost a -24% drop). If the USD is appreciating against other currencies, that makes US Treasuries that much more attractive to foreign investors. After all a European could have made fantastic money just on the appreciation of the USD since May 6, 2014, if the European had owned US Treasuries. He/she would also have gotten the yield on the Treasuries. Plus since US Treasury yields have been going down, the European investor would have gotten appreciation on the price of the US Treasuries. Since many people think the devaluation of the Euro versus the USD is likely to continue as the ECB dispenses more QE in 2015, many Europeans seem likely to invest in US Treasuries. This should act to increase the prices (decrease the yields) of US Treasuries. That in turn is also motivation for investors (including Europeans and Japanese) to buy US utility stocks, which will likely have stable to increasing yields. All of the major economies other than the US have been increasing easing actions. The BOJ has a huge QE program . The PBOC has recently been announcing new easing programs . If there is a lot of extra liquidity around, people will not want to pay very much in interest rates to borrow money. Foreign investors will also be happy to keep their money in Treasuries of the one country with an appreciating currency (the one that is not doing more easing currently). The US Fed has talked about raising its rates, especially the Fed Funds rate. If it did this, that would likely lead to higher US Treasuries yields. However, this is increasingly unlikely. The US inflation rate was -0.1% in January 2015; and the overall trend has been strongly downward in recent months. If the US Fed tries to raise rates in that environment, it will only cause STAGFLATION. Further a raise in rates would cause the USD to appreciate that much faster; and the appreciation we have seen just since May 6, 2015 is already hurting US exports. It is also spurring foreign imports. Both of these items will tend to act to destroy US jobs, although there may be a lag in the effect. This would act directly against the Fed’s mandate on full employment. Plus it clearly doesn’t need to control inflation through a rate increase at this time, which is the Fed’s main mandate. On top of all of the above, NWE is a well run company that has seen steady growth. Adjusted EPS for Q4 2014 were $2.68 per common share (a +7.2% improvement over Q4 2013). For FY2014 GAAP Net Income was $120.7 million (or $2.99 per diluted share) compared to $94.0 million of $2.46 per diluted share for FY2013 — a 22% improvement. GAAP Net Income guidance for FY2015 is for $3.10-$3.30 per diluted share — a midpoint 7% improvement. This is good growth for a utility. A key factor in NWE’s growth will be the new Hydro facilities purchased from PPL Montana in late 2014. These are eleven hydroelectric generating facilities ( 633 Megawatts ). They were obtained for $900 million. $870 million of that purchase price was added to the rate base with a 50-year life. Return on equity is expected to be 9.8%. The capital structure is 52% debt and 48% equity. This resulted in $400 million in issued equity (7.767 million shares issued at $51.50 per share) and $450 in new debt. The resulting first year annual retail revenue requirement is approximately $117 million. The debt is 30-year first mortgage bonds with a coupon of 4.176%. The all-in cost of the debt was 4.353%. Of this 4.25% is recoverable under the hydro approval granted by the Montana PSC. The transaction closed November 18, 2014. This should be a good new revenue source for FY2015. It should help NWE meet or exceed its guidance. The chart below shows NWE’s recent history of meeting or exceeding its guidance. (click to enlarge) As investors can see, there is a high likelihood that NWE will beat its initial FY2015 guidance. Any upward revisions during the year should help the stock rise. With a 3.67% dividend and an uptrend in the stock price that is almost unshakeable, NWE appears to be about as much of a sure thing as investors can find. When you add the quick recovery it showed from the Great Recession, it makes it even more attractive in a very uncertain market. We have already had six plus years of the current bull market. A bear market may be on the near horizon. If so, NWE may be a relatively good place to be. It will pay you a nice dividend to wait for a recovery in any stock price fall. Another point in NWE’s favor is that Fitch upgraded NWE’s Issuer Default Rating to BBB+ on November 5, 2014. Fitch gave as reasons: The acquisition of the hydroelectric portfolio. The low risk, regulated utility business model. The improved financial and business profile. Its moderating CapEx budget. From a metrics standpoint, the PE of 17.49 and the FPE of 15.34 indicate a currently reasonable price of $52.30 per share as of the close March 12, 2015. The average analysts’ one year price target is only $57.46 per share, but this could easily rise significantly if the new hydro facilities provide a bit more income than has likely been conservatively estimated. The Beta of 0.52 is also a positive in an uncertain market. NWE is a buy with an average analysts’ next five years EPS growth per annum forecast of 7.60%. This is outperformance in the utility industry. The comparable numbers for a few other major utilities are: Consolidated Edison — 2.77% EPS growth, Southern Company — 3.30% EPS growth, and Duke Energy (NYSE: DUK ) — 4.52% EPS growth. There has been no insider selling on NWE. NOTE: Some of the fundamental fiscal data above is from Yahoo Finance. Good Luck Trading/Investing. Disclosure: The author has no positions in any stocks mentioned, but may initiate a long position in NWE over the next 72 hours. (More…) The author wrote this article themselves, and it expresses their own opinions. The author is not receiving compensation for it (other than from Seeking Alpha). The author has no business relationship with any company whose stock is mentioned in this article.

European Funds See Inflows For 6-Consecutive Weeks

Stock funds attracted $8.4 billion for the week ending Mar 4, according to data from Lipper. This was the biggest inflow since late December. Of these, $6.9 billion was invested in non-U.S. stock funds. U.S.-focused stock funds added $1.5 billion. This came just a week after the U.S. investors had poured the most money into non-domestic stock funds since 2013. Jeff Tjornehoj, head of Lipper Americas Research said: I think those investors are expecting a rally in European stocks after the ECB opens the QE (quantitative easing) spigots next week. As for the broader markets, it has been a mixed week so far. Optimism that the U.S. economy was gradually picking up the pace had boosted benchmarks to record highs on Monday. Nasdaq had closed above the 5k mark for the first time since Mar 2000 boosted by a new deal in the technology sector. However, markets then dropped for two consecutive days, dragged down by dismal monthly car sales and a drop in private-sector employment gains in February, among other factors. Markets rebounded on Thursday, somewhat boosted by the ECB announcing a trillion-dollar stimulus plan that will kick off on Monday. Till close of markets on Mar 5, the Dow and Nasdaq are up just 0.02% and 0.07%, while the S&P 500 is down 0.2%. Funds Flow Data As mentioned, while $6.9 billion was poured into non-U.S. stock funds, U.S.-focused stock funds added $1.5 billion. U.S.-focused stock funds were able to witness inflows, after it lost $3.1 billion in outflows in the prior week. This was the biggest outflow in three weeks. Coming back to this week, U.S.-based European stock funds witnessed inflows for the sixth-consecutive week, adding $708 million for week ending Mar 4. Inflows into these funds may have been due to investors’ expectation of a rally as the ECB begins the bond repurchase plan. Emerging market stock funds added $1.4 billion, the most since Jun 2014. Separately, Taxable bond funds and high-yield “junk” bond funds registered their ninth and sixth consecutive week of inflows, respectively. While taxable bond funds added $170 million, the latter attracted $309 million. U.S. Treasuries funds had the biggest outflows since Jun 2014, losing out on $2.8 billion. On the other hand, the Investment Company Institute reported total money market fund assets were $2.67 trillion for the week ended Mar 4, down by $18.60 billion. Markets and Key Developments This Week On Monday, Nasdaq closed above the 5000 mark for the first time since Mar 2000 boosted by a new deal in technology sector. The Dow and the S&P 500 also touched record highs as the U.S. economy is seen to be gradually picking up the pace. Markets ended in the green, despite reports of a slowdown in manufacturing activity and consumer spending. Meanwhile, interest cuts in China also drove benchmarks higher on Monday. The S&P 500 and Dow closed at a record high for the fifth and fourth time this year, respectively. Dismal monthly car sales report dragged benchmarks down from their record highs in light volume trade on Tuesday. Profit taking also retreated Nasdaq from its key 5K level. Also affecting the markets was Israeli Prime Minister Benjamin Netanyahu’s criticism of White House and Iran’s attempts of a nuclear deal. Markets ended in the red for the second consecutive day on Wednesday, handing the Dow and S&P 500 their worst closing levels since Feb 19. Some opined there was no real panic in the markets. Private-sector employment gains in February were lower than prior month. Separately, ISM services index showed modest improvement. Markets snapped a two-day losing streak on Thursday, somewhat boosted by the ECB announcing a trillion-dollar stimulus plan that will kick off on Monday. Higher-than-expected initial claims numbers had offset some gains on Thursday. It was the year’s second lightest trading session, as investors refrained from betting big bucks ahead of Friday’s nonfarm payroll report. The jobs number may influence the timing of the rate hike decision. ECB Stimulus : The European Central Bank (ECB) announced a 1 trillion euro ($1.1 trillion) bond-buying program. The repurchase is due to start from coming Monday, Mar 9. As announced in January, ECB will buy government bonds worth 60 billion euros a month through a quantitative easing program. The QE program will continue till Sep 2016. ECB President Mario Draghi said this time that ECB would purchase these bonds even if they have a negative yield. However, the negative yield should not cross -0.2%, as they need to be within the level of ECB’s deposit rate. The bank also increased growth and inflation targets. Growth estimates were revised up to 1.5%, 1.9% and 2.1% for 2015, 2016 and 2017 respectively. Draghi said: The substantial, additional easing of our monetary policy stands, supports and reinforces the emergence of more favorable developments of the euro area economy, financial market conditions and the cost of external finance for the private economy have eased further. Borrowing conditions for firms and households have improved considerably. Obamacare in Court : Another key event of this week has been the commencement of the third hearing on Obamacare in the U.S. Supreme Court. King v. Burwell is the biggest challenge Obamacare has had to deal with till now and threatens to derail President Obama’s signature policy measure. 3 Mutual Funds to Buy Given the continued inflows into the non-US stock funds and particularly in the U.S.-based European stock funds, we would suggest 3 Non-US Equity funds, that are likely to see further upside. These funds carry either a Zacks Mutual Fund Rank #1 (Strong Buy) or Zacks Mutual Fund Rank #2 (Buy). Remember, the goal of the Zacks Mutual Fund Rank is to guide investors to identify potential winners and losers. Unlike most of the fund-rating systems, the Zacks Mutual Fund Rank is not just focused on past performance, but the likely future success of the fund. Also, the funds have high total return over the last four weeks, carry no sales load and have low expense ratio. The minimum initial investment in these funds is $5000. Henderson European Focus Fund (MUTF: HFEIX ) seeks capital growth over the long term. The fund invests a majority of its net assets in equities of European firms. The fund has no limits regarding geographic asset distribution within Europe. It may invest in one country or limited number of countries. HFEIX carries a Zacks Mutual Fund Rank #2. It has returned 8.1% over the last four weeks. It carries an expense ratio of 1.11% as compared to category average of 1.50%. Ivy International Core Equity Fund (MUTF: ICEIX ) invests a lion’s share of its assets, and borrowings, in equities that are mostly traded in developed European and Asian/Pacific Basin markets. To boost return, the fund may also invest in those issuers who are either located or operate in emerging market countries. ICEIX carries a Zacks Mutual Fund Rank #1. It has returned 5.5% over the last four weeks. It carries an expense ratio of 1.04% as compared to category average of 1.19%. VY T. Rowe Price International Stock Portfolio (MUTF: IMASX ) seeks capital appreciation over the long term. The fund invests a majority of its assets in stocks of companies located outside the U.S. For diversification, the fund invests in among developed and emerging countries. The fund emphasizes large-cap companies, and to an extent also invests in mid-cap firms. However, the fund may invest in companies of all sizes. IMASX carries a Zacks Mutual Fund Rank #2. It has returned 5.5% over the last four weeks. It carries an expense ratio of 0.77% as compared to category average of 1.37%.