Tag Archives: etfs

Will The Fed And China Bring GLD Back Up?

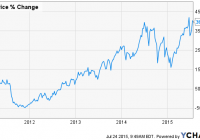
Summary The FOMC will convene again next week. China has been stocking up on gold in the past few years. Will China’s strong demand for the yellow metal save GLD? The U.S. GDP for Q2 will also be released this week. Will it move the price of GLD? The recent plunge in the price of SPDR Gold Trust (NYSEARCA: GLD ) brought the gold ETF to its lowest level since 2010. The weakness of China’s economy, the expectations of a rate hike by the Federal Reserve, the recovery of the U.S. dollar , and the general bearish sentiment in the commodities markets are keeping gold down. Even the recent news of the high growth in China’s gold accumulation hasn’t stopped the price of GLD from falling. Let’s examine some of these issues with respect to the general direction of GLD. The Fed and GLD The bets around the first rate hike of the Federal Reserve continue. For now, the market still places very low odds on a rate hike in September: the implied probabilities are only 19% — slightly higher than back in late June, albeit this probability is still low; for the October meeting the odds are 36% and for December the odds are 56%. St. Louis Fed President Bullard recently stated that the odds of a rate hike in September are actually better than even. Also, the Fed inadvertently published that staff economists also expect a rate gain this year. In any case, a rate hike, even just 0.25%, will have more of an impact on the market expectations, which could drive further down the price of GLD. In a related story, the San Francisco Fed released a paper , in which the current U.S. inflation does not signal a statistically significant deviation from the inflation target, considering the high monthly volatility in inflation estimates. This paper is optimistic about the progress of U.S. inflation that will eventually rise to the Fed’s target of 2%, even though it wasn’t able to bring inflation to this level over the past three years. This week, the FOMC will convene again. The FOMC isn’t expected to change its policy in the upcoming meeting, but it will show if the FOMC members are turning more dovish and getting ready for liftoff in September. One factor, among several, that could impact members’ decision about the timing of the rate hike is the upcoming GDP report for the second quarter. The current expectations are for the GDP for Q2 to show a growth rate of 2.7% — any negative surprise of lower growth rate could reduce the odds of a rate hike anytime soon and tilt the scales back to the doves in the Fed. China stocking up on gold China has finally revealed the amount of gold it has been stocking up in the past several years. The amount of gold rose from 1,054 tons back in April 2009 to 1,658 tons in June 2015 – 57% increase during the entire period or an average annual gain of around 8%. This puts China as the fifth biggest hoarder of gold among all countries. China also bought gold at a faster pace than any other country. This accumulation rate seems impressive, but a more detailed examination reveals the country has also increased its foreign exchange reserves during that period from a net worth of $2,008 billion to around 3,609 billion as of June 2015 for an 84% growth. But even if we were to consider the net value of gold, which also grew during that period (back in April 2009 gold price was $890 per ounce) then the value of China’s gold reserves from its foreign exchange reserves only inched up from 1.4% to 1.5%. So it remained relatively flat. In other words, the country hasn’t increased its share of gold from total foreign reserves. Moreover, China is already facing too many problems in keeping up the high surplus in its current account to further grow its foreign reserves. China’s economic growth is on shaky ground and so relying on China to drive GLD’s price back up to its former glory days may be questionable at best. Despite the negative sentiment related to the gold market, GLD could surprise and make short-term recoveries, especially if the FOMC were to present a more dovish statement and the U.S. GDP comes in short of market expectations. Even so, it will need a real change in the direction of the U.S. economy for the FOMC not to raise rates this year. Finally, as long as the FOMC considers normalizing its monetary policy in the coming months, GLD’s long-term outlook doesn’t seem positive. For more please see: Gold’s Flash Crash – What Happened to My Precious (Metal)? Disclosure: I/we have no positions in any stocks mentioned, and no plans to initiate any positions within the next 72 hours. (More…) I wrote this article myself, and it expresses my own opinions. I am not receiving compensation for it (other than from Seeking Alpha). I have no business relationship with any company whose stock is mentioned in this article.

5 Ways To Handle A Low Return On Capital Environment

Summary Basic market valuation fundamentals suggest that investors should prepare for more muted returns from their equity portfolios. Economy wide transformations led by technological progress also support decreasing returns on capital. Although this low return on capital environment is undoubtedly more challenging, there are 5 strategies that can help investors build and manage a portfolio of stocks more effectively. CNBC pundits, analysts, hedge fund gurus and amateur market watchers love to make predictions about the future. They hum and haw about macro forces. They discuss the possible impacts of a rate increase and they debate the importance of China as the world’s growth engine. They try and pinpoint what the next “game-changing” technologies or companies will be and they try and estimate what the overall market will do. This preoccupation with the future is certainly fascinating to seasoned market participants but what does it all mean for the majority of investors who most likely have a large portion of their savings exposed to the stock market or at the very least is considering where to allocate their savings? At the very least market fundamentals and economy wide transformations suggest that investors should prepare for more muted returns from their equity portfolios. Market Fundamentals Suggest More Modest Returns First and foremost, basic market fundamentals support more modest returns. In terms of valuation, the Shiller CAPE ratio for the S&P 500 (NYSEARCA: SPY ) which is a cyclically adjusted price/earnings ratio – has been stuck at around 27 which is high given the median of 16. This represents its highest level since 2000 and suggests that profits are far higher than normal and should either plateau or sink from these highs, a process that may already be underway . In addition, Morningstar’s price/fair value chart suggests that value is becoming harder and harder to find. In addition, the current 12-month forward P/E ratio for the S&P 500 is 16.7. This P/E ratio is above the 5-year average of 13.9 and the 10-year average of 14.1. These valuation indicators are a cause for concern as low starting valuations have historically been one of the best indicators of market performance. Whether we are in a bubble on the verge of popping is unclear, yet what is obvious is that when prices are elevated versus earnings, future gains will be lower. Economy Wide Transformations Suggest Return On Capital Will Continue To Decrease Nevertheless, there is something more significant going on than just above average stock market valuations. More fundamentally, there are transformational economic forces that are re-shaping our societies and thus our markets. The effects of this technological progress indicate that the return on capital (or cost of capital) will decrease as technological progress increases. Why? Because technology makes innovation cheaper and thus capital more abundant. Think back to the industrial revolution. During this period it was virtually impossible for someone to start a business without substantial capital reserves. This was due to the fact that innovation was cap ex heavy (commodities, infrastructure, wages etc.). Fast-forward to today and things have changed dramatically. It has never been cheaper to start a business and thus we have large (by market cap not by employee count) companies like Facebook (NASDAQ: FB ) buying companies with 55 employees like WhatsApp for $19 billion dollars. This is a world in which the barriers to entry are dropping across all industries. Such “new age” businesses generate enormous wealth for shareholders and entrepreneurs, yet result in comparatively few new jobs. Instead, what is generated is a rapidly increasing supply of capital. Corporations are piling record amounts of cash and thus we have a lower demand for capital which causes an increasingly higher supply. The higher the supply of capital, the lower the returns on capital. Yet the transformational change does not stop here. Not only does technology make capital more abundant, it also makes capital markets and the allocation of abundant capital more efficient. This is evidenced by the rapid adoption of algorithmic trading and information technology which makes the flow of information more efficient. In this environment arbitrage opportunities become more difficult to find as information asymmetries become more unusual. There isn’t a day that goes by without a high profile hedge fund manager bemoaning the lack of opportunities for return. Thus, the cycle continues: abundant capital chasing fewer return opportunities leading to even lower returns. Nevertheless, all is not lost. Although this low return on capital environment is undoubtedly more challenging, these 5 strategies can help investors build and manage a portfolio of stocks more effectively. 1) Reset Intuitions and Assumptions Since the market bottomed in March 2009 the S&P 500 has returned around 20% on an annualized basis. This amounts to a tripling in value rising by a staggering $12.8 trillion. So given the forces outlined above which suggests lower future returns what can be expected? Traditionally, for a diversified portfolio of stocks the typical expected annual return has hovered around 6-7% . Is this lower number even reasonable? Some leading investment analysts are suggesting that a more reasonable number would be around an average of 2% annual return, after inflation and fees. Thus, projecting an annual return of around 5% would be a more useful guide. 2) Reduce Investment Costs In light of projected lower future returns, controlling a portfolio’s various costs will yield major benefits over time. For example, paying a 1% expense ratio on a balanced portfolio that earns 10 percent on an annualized basis takes a 10% cut out of the return. Lower that 10% portfolio return to 5% and a 1% expense gets much more significant. As such, purge any mutual funds replacing them with low cost ETFs and be sure to use a low cost broker. 3) Reconsider Asset Allocation Beware of over exposure to bonds. Starting yields on Treasury bonds have explained much of their performance over the subsequent decade and with yields as low as they are, overexposure to bonds will almost guarantee low returns. On the other hand investors who maintain higher allocations to equities will be better positioned to eke out the best returns possible over time. 3) Invest In Quality And Focus On Dividends Effectively dealing with a lower return environment starts with putting together a portfolio of high-quality stocks. Although high-flying growth stocks may be alluring, the risk of a terrible year of returns far outweighs the possible benefits of a fleeting moment of outperformance. Instead focus on ” wonderful businesses ” with high moats that are profitable and that will survive whatever an uncertain economy may throw at them. In addition, focus on dividends and their re-investment. Dividends have historically accounted for the vast majority of all stock returns for the last century. Some have even postulated that dividend growth is the most important factor for creating long-term wealth. Thus, companies with strong returns, consistent earnings and consistently growing payout ratios should see better than expected returns over the long term. 4) Consider Increasing Exposure to Non-U.S. stocks Despite reports of a “relatively stagnant” global economy, research suggests that there are many global markets that are projected to grow at high rates. Although foreign stock outperformance is no sure thing , there are certainly pockets of relative geographic market undervaluation worth considering. In Europe , the UK, Germany and Spain present compelling opportunities. Elsewhere, Singapore, Thailand, Australia and Russia remain significantly undervalued by Prof. Shiller’s CAPE measure. 5) Avoid Chasing Returns And Stay Focused On The Long-Term Common during bull markets yet even more common when markets are going sideways is the impulse to buy stocks that are skyrocketing while your portfolio remains grounded. Yet if you chase the best-performing stocks or sectors you risk leaving your plan behind and jumping in when these assets are reaching their peak. Try and relax, pay attention to valuation and stick to your long-term dividend growth plan. Disclosure: I/we have no positions in any stocks mentioned, and no plans to initiate any positions within the next 72 hours. (More…) I wrote this article myself, and it expresses my own opinions. I am not receiving compensation for it (other than from Seeking Alpha). I have no business relationship with any company whose stock is mentioned in this article.

The Beginner’s Guide To Volatility: XIV

Summary We will cover the basics of XIV. How the performance of VIX futures dictates XIV value. Equitable advice for how to trade XIV. Welcome to part two of: The Beginners Guide to Volatility. These articles are built to serve as educational tools for you to gain a proper understanding of volatility ETFs before you invest in them. For part one: The Beginners Guide to Volatility: VXX, click here . In part one, we discussed pro-volatility products that benefit from increasing volatility and are hurt over the long term from the effects of contango. You may be wondering where that money goes. The answer is inverse volatility products. These instruments bet on decreasing volatility and are aided over time by the effects of contango. As the basis for discussion, we will use the most popular (currently by AUM) inverse ETN, the VelocityShares Daily Inverse VIX Short-Term ETN (NASDAQ: XIV ). There is some debate on the ETN vs. ETF factor and which one is ultimately better when compared to the ProShares Short VIX Short-Term Futures ETF (NYSEARCA: SVXY ). If you look at the long-term chart for both XIV and SVXY, they have near identical returns. SVXY does produce a K-1 tax form , which is a pain. SVXY trades options and XIV does not. I personally like options and trading options bypasses the K-1 form because you never own the security (unless you assigned). Options are a different subject, and I have separate articles dedicated to them. If you are looking to simply buy and hold an inverse volatility product for a short period of time, then I would recommend using XIV. Let’s start by looking at the long-term chart of XIV: If you read part one of this series, then you already know how contango negatively affects pro-volatility products. It has the opposite effect on inverse volatility products. Short-term inverse volatility products sell second-month futures contracts and then hold them short for periods of around 30 days, afterwards the contract is purchased and the process repeats itself. See below for a visual: (click to enlarge) As long as futures are in contango, which is when the first month’s (front month) futures contract is cheaper than the second month’s contract, then XIV will profit. The only exception would be if futures rise a rate higher than that of the contango. Another way that XIV profits is from decreasing volatility. See below for another visual: (click to enlarge) Here is a chart of XIV over the same period of time: Common Misconceptions One misconception I see quite frequently is that anytime is a good time to buy these products. They are often touted as the best investments. This is false. The best time to buy these products is during periods of high volatility and when futures are in backwardation. Backwardation is the opposite of contango and will cause a loss of value in XIV over time. Economics should play a large role in your decision to purchase XIV during backwardation. Should economic conditions deteriorate, then you could be looking at steep losses. Since these products have inception dates in 2010 and 2011, respectively, there is a degree of uncertainty with how they will perform during periods of economic recession. We do know how XIV would have performed in 2011 when fears of a double dip recession and global growth fears weighed heavily on U.S. markets. Thanks to back testing, we are able to manufacture pricing data on VIX futures products from 2004 on. See below for the long-term back tested chart of XIV: (click to enlarge) Chart created by Nathan Buehler using historical data from The Intelligent Investor Blog . Only trading dates (Mon-Fri) were used, but Excel automatically includes Saturdays and Sundays in the axis. As you can see from the above chart, there are good times and bad times to invest in XIV. During periods of recession, you should expect XIV to lose around 90%+ of its value. More back testing is available on SVXY here . The other misconception, that goes along with any volatility futures products, is that XIV tracks the VIX. It does not track the VIX. The VIX Index is not investable. XIV tracks the VIX futures and the VIX futures trade independent of the market and level of stock prices. For more information on these misconceptions, please view part one of the series. Backwardation Backwardation is your number one risk for holding XIV over long periods of time. A simple rise and subsequent fall in volatility would make it relatively risk free. However, backwardation permanently removes value from inverse volatility products during these events. See below for a visual: (click to enlarge) Below is a chart of the price action in XIV during the same period of time: Even though futures traded lower on 12/18/14 than they did on 12/10/14, XIV experienced a loss of value of 2.88%. Again, this was due to the permanent value loss caused by contango. During 2008, it wasn’t just higher volatility that crippled XIV, it was the ultra-high level of backwardation that came with it. (click to enlarge) Chart created by Nathan Buehler using historical data from The Intelligent Investor Blog. Only trading dates (Mon-Fri) were used, but Excel automatically includes Saturdays and Sundays in the axis. Is it rigged? Those that trade inverse volatility products seem to have less notion that the vehicles they invest in are flawed or rigged. These complainers will often come out on the pro-volatility side when things aren’t going their way, which is almost all of the time. These same types of complainers should be expected if inverse volatility products also begin to perform poorly. Currently, we are experiencing very low volatility. Historically, this provides the least reward for the risks involved. It is easy to call something rigged when you don’t understand how it works and it performs differently than you want it to. Gambling and volatility trading go hand in hand for some people. If you fully know and understand the game, volatility trading performs exactly as intended. Conclusion Inverse volatility products produce above-average returns during periods of economic growth. However, the risks they carry during periods of economic retraction should be fully understood by the investor. XIV will benefit from the contango that drags on pro-volatility products. Rising volatility and backwardation are conditions that should be monitored closely when evaluating a position in XIV. Current advice We are currently experiencing low volatility in relation to historical norms. See below: Economics and market psychology ultimately drive the VIX. A great series I like to watch is Jeff Millers “Weighing the Week Ahead.” You can view Jeff’s profile here . As we spoke about before, backwardation and spikes in volatility create the best entry points for XIV. Futures are currently far from backwardation, and I would wait for a better risk/reward entry point. Please follow me here on Seeking Alpha for more tips, education, and news about volatility. Keep an eye out for the last article in this series where we look at mid-term futures products. Disclosure: I/we have no positions in any stocks mentioned, and no plans to initiate any positions within the next 72 hours. (More…) I wrote this article myself, and it expresses my own opinions. I am not receiving compensation for it (other than from Seeking Alpha). I have no business relationship with any company whose stock is mentioned in this article.