Beware The Death Cross?
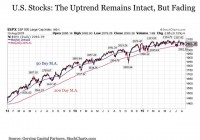
Summary A most ominous event came to pass this week. For the first time in four years, we witnessed a “death cross” in the broader U.S. stock market. It’s worthwhile to consider the death cross in historical context to determine its significance if any to investors today. A most ominous event came to pass this week. For the first time in four years, we witnessed a “death cross” in the broader U.S. stock market. The mere name alone may cause investors to think that they should be taking action. After all, if we are reading about a death cross in the business news headlines, it certainly can’t be a good thing, right? While a death cross is widely considered a bearish signal that stocks are about to break lower, this is not necessarily the case when examining these episodes from a historical perspective. This does not mean that it should be completely ignored, but at a minimum it must be taken in context. Dissecting The “Death Cross” So what exactly is the death cross? It takes place when the average closing price of the U.S. stock market over the last 50 days (a shorter term trend reading) falls below the average closing price over the last 200 days (a longer term trend reading). To many investors, the fact that the shorter-term trend in the 50-day moving average has crossed below the longer term trend in the 200-day moving average is a signal that the overall market trend may be reversing to head much lower. As a result, some investors are inclined to use the death cross as a signal that it may be time to start exiting stock positions to protect against portfolio losses. Before going any further, it’s important to make a key distinction about the recent death cross that we have been hearing about. It took place on the Dow Jones Industrial Average (NYSEARCA: DIA ). And while I appreciate the historical significance and its well-known status among the broader general public, the Dow is not a U.S. stock market index to which I pay much attention. This is due to the fact that it’s an index that’s not only limited in its number of holdings at just 30 stocks, but it also is a price weighted index instead of being market cap or equal weighted. As a result, price movements in Goldman Sachs (NYSE: GS ) trading at $200 per share has a disproportionately larger impact on the Dow on any given day than General Electric (NYSE: GE ) or Cisco (NASDAQ: CSCO ) that are trading in the $20s despite the fact that both are meaningfully larger in terms of market cap. Instead, I prefer to monitor the S&P 500 Index (NYSEARCA: SPY ), which consists of a much broader universe of 500 stocks and is market cap weighted, along with a variety of other indices. And to date, the S&P 500 Index is still trading with a 50-day moving average that’s still nearly 1% above its 200-day moving average. In other words, while we have witnessed a death cross on the Dow, it has yet to take place on the broader S&P 500. This is not to say that we won’t see a death cross in the S&P 500 Index soon, but it should be noted that we have not yet seen one to date. Moreover, the uptrend in U.S. stocks remains very much intact despite the extended period of sideways trading that has taken place since late 2014. (click to enlarge) But given the fact that the S&P 500 is as close to a death cross as it has been in years, it’s still worthwhile to consider the implications of such an event. To begin with, the death cross is a fairly uncommon occurrence for the U.S. stock market. Over the last 85 years, stocks as measured by the S&P 500 Index have experienced a Death Cross on 44 separate occasions. The last such instance took place in 2011, which is shown in the chart below. (click to enlarge) The death cross is a fairly rare experience. But do they matter? Not nearly as much as the name might suggest. First, it’s important to note that a fair amount of stock market downside has typically been absorbed by the time the death cross takes place. Historically, this supposedly bearish crossover has historically occurred 74 trading days on average following a market peak for an average decline of -10.66%. In short, investors are already down double-digits on average before the death cross alarms have been triggered. With that being said, it’s worth noting that today’s market is setting up a bit differently. Through Friday, August 14, we are now 59 trading days removed from our most recent market S&P 500 peak on May 20 (although it should be noted that we came extremely close to a new high just 18 trading days ago on July 20). And if a death cross were to take place today, it would only have stocks down less than -3% from their peaks. As a result, it could be argued that such a signal this time around might provide some protection against more meaningful downside that might follow this time around. Exploring this point in more detail, stocks have continued lower for another 77 days on average after a Death Cross before bottoming with an average decline of -12.21%. As a result, if average historical precedence held, taking action might protect an investor from absorbing a mid to high single digit portfolio decline on average. But the risk may outweigh the reward by undertaking such an approach for the stock market has shown the propensity on a meaningful number of instances to be at or near a bottom by the time a death cross has taken place. For example, in eight of the 44 past Death Crosses in the last 87 years, the stock market has bottomed immediately on the day that this bearish crossover has taken place. In other words, an investor using the death cross as an exit signal would have them selling at the exact bottom of the market 18% of the time. And a one in five chance of bottom ticking a stock market pullback is a risk that investors should take into consideration. Taking this a step further, the potential for bottom picking on a death cross signal becomes measurably worse when incrementally expanding the time horizon. For in another 12 of the 44 past death crosses, or another 27% of the time, the stock market bottomed within 10 trading days after the bearish crossover occurred. And four more, or an additional 9% of the time, stocks bottomed within 25 trading days, or roughly a month, after the death cross took place. Putting this all together, at 24 out of 44 instances, or 55% of the time, the death cross is more likely to signal that a short-term bottom is imminent for investors than that a long-term correction is underway. As a result, despite its ominous sounding name, investors should not be quick to react upon hearing that a death cross has taken place. What About The Other 45% Of The Time? None of this means, however, that the death cross should be completely ignored. For it does provide some useful leading signals that investors should consider in protecting against any future market correction or outright bear market. First, while the actual crossover of the 50-day moving average below the 200-day moving average comes too late to be useful from a trading perspective in many instances, the spread between the 50-day and 200-day moving average can serve as a useful leading indicator about the continuing strength of the stock market going forward. Over time, a spread between the 50-day and 200-day moving average between 5% and 10% is considered strong. But what we have seen since the market peak in early 2013 is that the strength of the U.S. stock market has been gradually but steadily fading in the two plus years since. What this suggests is that the third longest bull market in history is increasingly running out of gas. Could it reverse to the upside? Absolutely, but we have seen nothing to suggest a revival in stock market strength in this regard for more than two years running. (click to enlarge) Another consideration is the average amount of time between death crosses. While as suggested above that most such crossovers have often been better predictors of short-term market bottoms than long-term market reversals, nine out of 44 past instances, or 20% of the time, have been followed by extended market corrections if not full blown bear markets. And each of these nine instances has taken place following what have been far longer than normal periods of time between death crosses. For example, when U.S. stocks have gone more than 500 trading days between death crosses, the probability that it’s followed by an outright bear market including a decline greater than -20% increases to roughly half. And given the fact that we are now at 1,007 trading days and counting since the last death cross in 2011, we are operating today with risk levels considerably elevated in this regard. Bottom Line While the death cross is an ominous sounding event that we are likely to hear more about if the market continues to grind, it’s not nearly the bearish indicator that the name suggests. More often than not, it serves as a signal that a short-term bottom in stocks may be imminent. But with that being said, it’s still useful for long-term investors that are viewing the information in the right context. And while a death cross in stocks should not be viewed in isolation as anything that requires urgent portfolio action, it does hold more meaningful significance in the current environment when considered in the context of the market environment that we are operating in today. Disclosure : This article is for information purposes only. There are risks involved with investing including loss of principal. Gerring Capital Partners makes no explicit or implicit guarantee with respect to performance or the outcome of any investment or projections made. There is no guarantee that the goals of the strategies discussed by Gerring Capital Partners will be met. Disclosure: I/we have no positions in any stocks mentioned, and no plans to initiate any positions within the next 72 hours. (More…) I wrote this article myself, and it expresses my own opinions. I am not receiving compensation for it (other than from Seeking Alpha). I have no business relationship with any company whose stock is mentioned in this article.