Tag Archives: etf-monkey

An ETF That Is A Dividend Growth Investor’s Best Friend

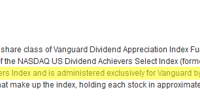
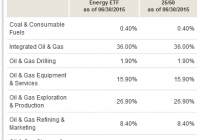
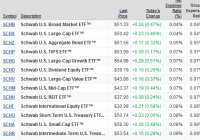
Summary As you might surmise from my chosen pseudonym, ETF Monkey, my portfolio is comprised mostly of ETFs. Awhile back, I gave serious thought to building a “mini ETF” of my own comprised of solid, dividend-paying, stocks. In the end, however, I settled on increasing my weighting in an ETF that I feel may do the job better than I could have done it myself. As probably comes as no surprise, based on my chosen pseudonym of ETF Monkey, my portfolio is comprised mainly of ETFs. In fact, as of this morning, 78.95% of my portfolio is in ETFs. Adding in my cash balance of 12.52%, that means that only 8.53% of my portfolio is in individual stocks. Which individual stocks, and why I selected them, may be the subject of a future article. As a middle-aged and fairly conservative investor, I also love dividends and the solid companies that pay them. Awhile back, I seriously considered carefully selecting perhaps 10 such stocks to add to my portfolio; stocks in companies with solid economic moats, a strong and consistent history of dividend payments, and solid prospects for the future. In other words, the sort of stock that I would be willing to buy and hold for the metaphorical “forever.” I did some work, compared various sources and research, and started to build my list. Long story short, I set it all aside. Why? Because the more I thought about and researched one ETF–ironically, one I already owned–the more I found myself in favor of simply adding weighting in that ETF. And what, pray tell, is this ETF? It is the Vanguard Dividend Appreciation ETF (NYSEARCA: VIG ). Before we dive deep into the details of this particular ETF, let me first quickly address a couple of practical considerations I pondered: Expenses – One of the things I really appreciate about Vanguard is that they offer a wide variety of ETFs–including some that are specialized–at extremely low expense ratios. In the case of VIG, it is a mere .10%. For perspective, if I were to trade my proposed 10 stocks individually, with an $8 commission I would need to trade in chunks of at least $8,000 (per stock) to generate a trading cost of .10%. “Yes, but that is only one time,” I hear some objecting, “not year after year.” This is true, but that leads me to.. Stock Selection – Selecting 10 individual stocks would mean I would first need to narrow down my choices from a large number of candidates and buy them. But it would not stop there. Moving forward, I would need to track them and make future decisions, likely involving more trades. This could range from simple re-weighting, as needed, all the way to the question of whether I had made a bad choice (or two) and really should swap it for something else. Now, before I go any further, a caveat. I will explain the choice I made. That doesn’t mean the choice is right for everyone. But, for me, I was not convinced that I would necessarily be able to do better than to pick a high-quality ETF that attempted to do the same thing. So, I decided to see if I could find one that matched the philosophy of what I wished to accomplish. Ultimately, as mentioned, I settled on VIG. “But There Are ETFs With Higher Dividend Payouts” Please allow me to anticipate one potential objection and get it out of the way right away. VIG does not have the highest current dividend ratio of many of the specialized ETFs that play in this area. In fact, Vanguard’s factsheet for VIG reveals a 30-Day SEC Yield of “only” 2.19% as of 8/17/15. For me, though, today’s yield is not the main consideration. You see, every single company in the base index from which this fund is built has a history of “at least 10 consecutive years of increasing annual regular dividend payments.” Such a track record speaks volumes about the financial management of these companies. Not only does it mean that they have a history of rewarding shareholders, but it also means that they run their businesses with a great deal of financial discipline. Think about one last thing before we leave this section. Such a history over 10 years means that these companies maintained this record through the horrible downturn from 2007-2009. In summary, I made a decision that I wanted to think with a view to the long term, and select the type of companies that would give me a great chance of reaching my goals. A Truly Unique ETF As it turns out, VIG is truly a unique ETF. I stumbled across a very interesting tidbit when I took a look at VIG’s investment strategy and policy page. (click to enlarge) That stopped me in my tracks. Is it really the case that there is an index administered exclusively for Vanguard? Turns out, there is. Here, from the methodology fact sheet for the NASDAQ U.S. Dividend Achievers Select Index , is the eligibility criteria: (click to enlarge) Note that last bullet; “additional proprietary eligibility.” To confirm this, if you look at the overview sheet for the index, you will see that only one ETF product is based on that index; VIG. Here are a couple of other points of interest about the index: A thorough evaluation of all securities in the index is performed every March. All resulting additions or deletions are effective after the close of trading on the third Friday in March. However, a security which ceases to meet the criteria for inclusion in the index may be removed at any time during the year. The portfolio is rebalanced annually such that the maximum weight of any security in the index does not exceed 4%. This takes place as of the last trading day in February. Composition With 181 securities in both the index and fund, VIG is fairly focused. It forms a nice addition to a portfolio that is anchored by a “total market” ETF, such as the Vanguard Total Stock Market ETF (NYSEARCA: VTI ). Here are a couple of extremely helpful screen shots with more details on the fund’s composition. First, from the latest fact sheet Vanguard provides to institutions . What I liked about this presentation is that it captured both the Top-10 holdings and sector breakdown right next to each other: (click to enlarge) A couple of quick observations: You may note that Microsoft has temporarily exceeded the 4% maximum weighting target. This will automatically remedied, if appropriate, at the annual rebalancing process. This index excludes REITs. I like that because it allows you to add REITs separately if desired, using an ETF such as Vanguard REIT Index ETF (NYSEARCA: VNQ ). The index notes make it clear that this decision was made because REIT dividends do not enjoy the same tax advantages as corporate dividends and, therefore, that you may not wish to include REITs in a taxable account. Here’s the second picture, from the fact sheet for the index itself. Please note the decided tilt toward large-cap securities. Performance As we sit with the U.S. market close to historical highs, and with many observers theorizing that it may be a little “frothy” at the moment, it is certainly valid to ask how VIG might perform in the event of a correction, or worse. If history is any indicator, it may do reasonably well. Here is a chart showing VIG’s performance against the S&P 500 index during the severe downturn the market experienced between 10/1/2007 and the bottom on 3/9/2009. VIG data by YCharts While the downturn was dramatic in all cases, VIG managed to outperform by some 8.5% over that period, not including dividend distributions. To be fair, though, let’s look at the other side of the coin. How have both fared since the historical bottom on March 9, 2009? Have a look at this chart. VIG data by YCharts Clearly, in rising markets, VIG tends to underperform. Of course, this analysis also excludes dividend distributions. Given where the market sits at the present time, I feel good about having something I view as at least slightly defensive in my portfolio. Summary and Conclusion As mentioned in the outset, I looked long and hard at building what I might describe as a “mini ETF” of dividend paying stocks for myself. The more I looked at VIG, however, the more I wondered if I genuinely could do better. VIG contains the kind of stocks I want as underpinnings of my portfolio. Since I will only have to trade it very intermittently, it will keep my trading costs low. And that low .10% expense ratio, to me, is a small price to pay for having a diversified base of 180 or so of these types of stocks, in industries I like, and rebalanced as necessary for me. What about you? I’d love to hear your thoughts. Happy investing! Disclosure: I am/we are long VIG, VNQ, VTI. (More…) I wrote this article myself, and it expresses my own opinions. I am not receiving compensation for it (other than from Seeking Alpha). I have no business relationship with any company whose stock is mentioned in this article. Additional disclosure: I am not a registered investment advisor or broker/dealer. Readers are advised that the material contained herein should be used solely for informational purposes, and to consult with their personal tax or financial advisors as to its applicability to their circumstances. Investing involves risk, including the loss of principal.

The Oil Crash: 3 ETFs For Targeted Investment In The Energy Sector

Summary My breakfast reading this morning was an article from a fellow Seeking Alpha author suggesting that bargains could be found in the energy sector. While disagreeing with nothing in his article, I wondered what I could offer an investor who might be interested in using ETFs for a diversified investment in the sector. I came up with three solid candidates. This article will provide a brief overview. As a Seeking Alpha author myself, as time allows I enjoy reading as many articles as I can from fellow authors. My breakfast reading this morning included this article from fellow Seeking Alpha author Regarded Solutions . I think it is a great article, and well worth taking the time to read it for yourself. Essentially, though, the premise was as follows: The energy sector has been killed recently, due to the low price of oil. However, unless one believes in the imminent demise of oil and all its uses, now may be a good time to at least look at scaling into bargains. In particular, the author recommends taking a hard look at Exxon Mobil (NYSE: XOM ). Before I go any further, let me be explicit that it is not the purpose of my article to either dispute any of the points in his article nor to diminish anyone’s interest in purchasing shares in Exxon Mobil. However, I am ETF Monkey, after all. “What,” I thought, “might I suggest to the person who liked the concept, but wished to employ the power of ETFs to diversify their risk, as well as possibly invest in small, incremental chunks?” My research led to three quality candidates: Vanguard Energy ETF (NYSEARCA: VDE ) Energy Select Sector SPDR Fund (NYSEARCA: XLE ) iShares U.S. Energy ETF (NYSEARCA: IYE ) Let’s take a quick look at each ETF, and then I will offer a couple of concluding comments at the end. Vanguard Energy ETF Let’s start with some relevant data from the current factsheet . VDE has an inception date of 9/23/04, so has been around for almost 11 years. It tracks the MCSI USA Energy IMI 25/50 Index . As of 6/30/15, the fund contains 151 stocks, compared to 149 in the index. It has $5.0 billion in Assets Under Management (AUM). In classic Vanguard fashion, it carries a very low .12% expense ratio and has an average spread of .03%, very good performance for a sector-specific ETF. Finally, it carries a 30-day SEC yield as of 7/27/15 of 2.76%. Here is a look at the sector breakdown: Next, let’s have a look at the Top 10 holdings, after which I will offer a couple of comments. (click to enlarge) I’d just like to draw your attention to a couple of things: You may have noted that Exxon Mobil is the fund’s top holding, at 21.3%. In other words, for every $1,000 you invest, you are essentially investing $213 in Exxon Mobil. Even though there are 151 stocks in the portfolio, the Top 10 comprises 62.1% of total net assets. This is a much higher concentration than a broader market index ETF, such as the Vanguard Total Stock Market ETF (NYSEARCA: VTI ), for which the Top 10 holdings only comprise 14.4% of total net assets. However, in this context, this is a good thing. You are still making a very targeted investment in a sector, while still retaining a measure of defense against single-entity risk . Within the sector, the major portion of your funds are in developed, established companies. Energy Select Sector SPDR Fund Again, let’s start with relevant data from the latest factsheet . XLE, from State Street Global Advisors (NYSE: STT ), one of the oldest providers of ETFs, has an inception date of 12/16/1998. It tracks the S&P Energy Select Sector Index . As of 6/30/15, the fund contains 42 stocks, compared to 40 in the index. It has $11.6 billion in AUM. The fund carries a very competitive .15% expense ratio and has an average spread of .01%, which is truly exemplary for a sector-specific ETF. Finally, it carries a 30-day SEC yield as of 7/27/15 of 2.89%. Here are the fund’s Top-10 holdings: A couple of notes: Despite the far smaller number of stocks in XLE vs. VDE (40 vs. 151), the Top 10 concentration is virtually the same; 61.64% for XLE vs. 62.10% for VDE. At the same time, Exxon Mobil’s weighting is “only” 16.38% here vs. 21.30% in VDE. Therefore, your decision between the two may at some level hinge on how much concentration you wish to have in Exxon. iShares U.S. Energy ETF As always, some relevant data from the latest factsheet . IYE, from BlackRock, Inc. (NYSE: BLK ), has an inception date of 6/12/00. It tracks the Dow Jones U.S. Oil & Gas Index . As of 6/30/15, the fund contains 92 stocks, compared to 93 in the index. It is the smallest of the three ETFs, with $1.27 billion in AUM. The fund has an average spread of .03%, and carries a 30-day SEC yield as of 6/30/15 of 2.50%. Unfortunately, IYE also carries an expense ratio of .45%, meaning that the fund would need to outperform our two competitors by some .3% per year to overcome the handicap from expenses. Here are the fund’s Top-10 holdings: My thoughts: IYE is in the middle of the pack in terms of diversification, with 92 holdings. It’s Top 10 concentration is the greatest of the three ETFs, at 63.69%. Its weighing in Exxon Mobil is also the highest of the three; at 22.57% vs. VDE’s 21.30% and XLE’s 16.38%. Again, this may factor into your decision if you desire a heavier weighting in Exxon. Comparative YTD Performance As featured in the article that inspired this offering, the energy sector has been hit hard recently. That being the case, how have our three ETFs performed? Have a look: VDE data by YCharts As you can see, VDE and XLE are in a virtual dead heat, with only .1% separating them. It becomes basically a tie when you factor in XLE’s slightly higher 2.89% vs. 2.76% SEC yield. Summary and Conclusion Based on my examination, I am going to call it a tie between VDE and XLE. Both have long track records. Both have impressive amounts of AUM. And both have very competitive expense ratios which, all other things being equal, ultimately puts money in your pocket. As always, though, I will include the caveat that the question of which ETF you can trade commission-free may factor into your ultimate decision, particularly if you wish to make multiple small, incremental investments. My thanks to Regarded Solutions for a wonderful inspiration, and to all of you for reading. Happy investing! Disclosure: I/we have no positions in any stocks mentioned, and no plans to initiate any positions within the next 72 hours. (More…) I wrote this article myself, and it expresses my own opinions. I am not receiving compensation for it (other than from Seeking Alpha). I have no business relationship with any company whose stock is mentioned in this article. Additional disclosure: I am not a registered investment advisor or broker/dealer. Readers are advised that the material contained herein should be used solely for informational purposes, and to consult with their personal tax or financial advisors as to its applicability to their circumstances. Investing involves risk, including the loss of principal.

ETFs For Your Core Domestic Stocks Portfolio: 3 Worthy Competitors

Summary Every ETF investor needs to consider what holdings will form the very core of their portfolio. For the portion relating to domestic stocks, in a previous article I featured Vanguard’s Total Stock Market ETF. In this article, I will examine two other worthy competitors, and analyze how they stack up against VTI. Every investor desirous of developing an ETF-based portfolio does well to start by selecting a few core holdings. In my view, such holdings should offer great diversification along with a rock-bottom cost structure. In a previous article for Seeking Alpha, I featured the Vanguard Total Stock Market ETF (NYSEARCA: VTI ). I concluded that one should seriously consider VTI as a core holding for the portion of your portfolio devoted to domestic stocks. However, there are several worthy competitors in the marketplace. And, they may be even more worthy if your brokerage offers commission-free trading in these ETFs; particularly if one of your goals is to invest regularly and in small increments. In this article, we will examine two such competitors; the Schwab U.S. Broad Market ETF (NYSEARCA: SCHB ) and the iShares Core S&P Total U.S. Stock Market ETF (NYSEARCA: ITOT ). We will compare their structure, expense ratio and other features against VTI, and see how they stack up. Schwab U.S. Broad Market ETF While the history of Charles Schwab (NYSE: SCHW ) traces back over 40 years, the firm is a fairly recent entrant to the ETF market, really getting into the area in a big way in 2009. However, once it committed, it quickly became a formidable competitor. The firm now sports no less than 13 ETFs featuring an expense ratio of .10% or less, as shown here: Heading the list is SCHB, with a market-leading .04% expense ratio. SCHB is based on the Dow Jones Broad Stock Market Index , which tracks the 2,500 largest publicly traded U.S. companies for which pricing information is readily available. This index is a subset of the Dow Jones U.S. Total Stock Market Index, but excludes companies defined as micro-caps. This index has a median market cap of $1.9 billion. Currently, there are exactly 2,506 stocks in this index. If you look at the informational table I include later in this article, you will note that SCHB only contains 2,020 stocks. The answer to why this is the case actually offers a helpful insight into how ETFs, particularly those with incredibly low expense ratios, are able to function. Here is the explanation given in the SCHB prospectus : Because it may not be possible or practicable to purchase all of the stocks in the index, the Adviser seeks to track the total return of the index by using statistical sampling techniques. These techniques involve investing in a limited number of index securities which, when taken together, are expected to perform similarly to the index as a whole. Look at that phrase “possible or practicable .” In other words, they are explaining that the trading costs involved in attempting to purchase every security in the index would lead to a greater tracking error (or divergence from the index) than their actual practice of sampling the index. In many ways, SCHB mirrors VTI quite closely. As of the date I researched this article, it has a 1.85% distribution yield, against 1.88% for VTI. The weighting of the Top 10 holdings in each fund is also virtually identical. The fund is significantly smaller than VTI, with “only” $5.0 billion in Assets Under Management (AUM) as compared to $55.6 billion for VTI. You will see a small reflection of this in average spread (see definition below) of .03% vs. VTI’s industry-low .01%. This simply reflects the massive daily volume that trades in VTI due to its size. iShares Core S&P Total U.S. Stock Market ETF Our second competitor is from the iShares family of ETFs offered by BlackRock, Inc (NYSE: BLK ). BlackRock is another formidable competitor in the sphere of low-cost ETFs, with 19 ETFs featuring an expense ratio of .10% or less . Several of these are Bond ETFs with specific maturity dates so, for the sake of brevity, I show here the 5 ETFs with an expense ratio of .09% or less: (click to enlarge) ITOT is based on the S&P Composite 1500 Index . This index combines the legendary S&P 500, the S&P MidCap 400, and the S&P SmallCap 600 indexes, and covers some 90% of the total U.S. market capitalization. It covers companies with market capitalization of approximately $350 million or greater, with a median market cap of $3.3 billion. You may recall that SCHB’s median market cap is $1.9 billion, signifying that it contains a larger percentage of small-caps than does ITOT. NOTE: If you are interested in a nice visual representation of the scope of the various indexes, I found a wonderful graphic on the bogleheads website. ITOT has a 1.80% distribution yield, against 1.88% for VTI. The weighting of the Top 10 holdings is slightly more concentrated than VTI, at 15.12% vs. 14.00%. The fund is the smallest of our 3 competitors, with $2.4 billion in Assets Under Management (AUM). As a result, the average spread (see definition below) is .05% compared to .03% for SCHB and .01% for VTI. Key Comparative Information I have prepared the tables below as a quick visual comparative reference to help you evaluate the three ETFs side-by-side. First, some key high-level information: VTI, SCHB, and ITOT: Key Information VTI SCHB ITOT Assets Under Management (AUM) $55.6 Billion $5.0 Billion $2.4 Billion Index Tracked CRSP Total U.S. Market Index Dow Jones Broad Stock Market Index S&P Composite 1500 Index Number of Holdings 3,824 2,020 1,503 Weighting of Top-10 Holdings 14.00% 13.80% 15.12% Distribution Yield 1.88% 1.85% 1.80% Expense Ratio .05% .04% .07% Average Spread .01% .03% .05% Notes on terms that may be unclear: Distribution Yield refers to the ratio of distributions paid by the fund for the past 12 months divided by the Net Asset Value. Average Spread refers to the average price difference between the price buyers were willing to pay and sellers were willing to sell, averaged over the latest 45 days. Next, the sector breakdown: VTI, SCHB, and ITOT: Sector Breakdown VTI SCHB ITOT Financials 18.90% 17.90% 17.47% Technology 16.10% 18.70% 19.01% Health Care 14.00% 14.80% 14.92% Consumer Discretionary 13.80% 13.70% 13.01% Industrials 12.40% 10.50% 10.68% Consumer Staples 9.70% 8.40% 8.92% Energy 7.30% 6.80% 7.26% Utilities 3.00% 3.00% 3.04% Materials 2.80% 3.40% 3.44% Telecommunications 2.00% 2.00% 2.02% Other 0.00% 0.80% 0.23% TOTAL 100.0% 100.0% 100.0% Summary All three ETFs are worthy competitors. If you look at this YTD chart, you will see that VTI has a slight lead, and all three have outperformed the S&P 500. VTI data by YCharts If you look at this 5-year chart as a longer-term comparison, you will see that SCHB actually has a very slight lead over that time span, again with all three outperforming the S&P 500. VTI data by YCharts Setting aside the question of whether you can trade a particular ETF commission-free, here is my rating: VTI : In my mind, it was a very close battle between VTI and SCHB. Certainly, SCHB’s stunning .04% expense ratio is not to be ignored. Further, SCHB has slightly edged out VTI over the past 5 years. However, VTI’s slightly higher distribution ratio, huge size, extremely competitive .05% expense ratio, broader market coverage and recent outperformance nudge it to the #1 spot in my evaluation. SCHB : As I mention, this was a very close call. I think Schwab has done an incredible job putting together a world-class ETF for this category. I find it of no small note that SCHB has slightly edged out VTI over the past 5 years and its low expense ratio will doubtless make it extremely competitive as time moves forward. ITOT : Well, in a comparison of 3, one has to come out third. In this extremely tough head-to-head showdown, ITOT’s smaller size, .07% expense ratio and slight comparative underperformance weigh against it. On the other hand, its slight tilt toward large-caps might lower your risk in the event of a market downturn. I must say, however, that the question of which ETF you can trade commission-free may be the ultimate decider for you. Particularly will this come into play if regular, incremental, investments form a large part of your plan. Happy investing! Disclosure: I am/we are long VTI, ITOT. (More…) I wrote this article myself, and it expresses my own opinions. I am not receiving compensation for it (other than from Seeking Alpha). I have no business relationship with any company whose stock is mentioned in this article. Additional disclosure: I am not a registered investment advisor or broker/dealer. Readers are advised that the material contained herein should be used solely for informational purposes, and to consult with their personal tax or financial advisors as to its applicability to their circumstances. Investing involves risk, including the loss of principal.