Tag Archives: etf-hub

It Pays To Be Choosy In Emerging Markets

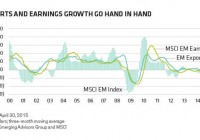
By Morgan C. Harting, CFA, CAIA Emerging equities remain rich in return opportunity, in our view. But as their recent whiplash behavior illustrates, capitalizing on this potential will require far greater selectivity than it did in the past. The recent selloff snapped a winning streak that had propelled the MSCI Emerging Markets Index up more than 11% through the end of April, far outpacing a flat S&P 500 performance. Still, the index remains well below its early 2011 levels, leaving most investors underweight and making this asset class one of the less crowded corners of the global equities market. In several countries, local investors have been buying stocks, pushing up market valuations and earning handsome returns – even though US$17 billion has been drained from emerging market equity funds so far this year. Worries about the US Federal Reserve’s impending first rate hike in a decade and a spike in currency volatility have dissuaded many foreign investors from taking broad emerging market exposure. Rallies in Russia and China Do domestic investors have an inside scoop on emerging market equities? Perhaps they’re less affected by country-specific concerns than foreign investors. For example, while foreign investors were worrying about the impact of sanctions on Russia, the local MICEX Index has marched higher; it’s now up more than 22% in US dollar terms this year. While global fund managers fixated on China’s slowing economic growth to a “mere” 6.5% and its corporate debt pileup, the Shanghai Composite Index surged 57%. Chinese retail investors have been opening up new brokerage accounts at a breakneck pace, encouraged by the government’s recent moves to boost economic growth and to open up its capital markets (including making it easier to use borrowed funds to buy stocks). Despite this local confidence, we don’t advocate a wholesale leap back into emerging markets. The powerful economic tailwinds of export growth, high commodity prices and domestic credit expansion that drove the asset class’s robust outperformance of the past decade have diminished. To find tomorrow’s winners, investors will need to make clearer distinctions among countries, companies and thematic opportunities. Exports Signal Caution A sharp focus on valuation and growth prospects remains central to our thinking about investments in emerging markets. One additional fundamental economic perspective that we believe is critical when considering the timing of allocations to emerging markets in portfolios is exports. Recent data from South Korea, which showed that exports declined by 10.9% year over year in May, as well as aggregate statistics over a longer time frame across a broader set of countries, simply don’t provide enough evidence of a broad resurgence in economic activity to justify an unconditional beta call today. It’s hard to find a metric tied as closely to emerging market equity returns – both fundamentally and empirically – as exports, in our view. When the US dollar value of exports from the developing world accelerates, positive operating leverage fuels even faster corporate profit growth and, in turn, stronger equity market returns. This is particularly true when valuations are as reasonable as they are today. Indeed, emerging market stocks are selling at 30% discounts to their developed market counterparts based on book value and 12-month forward earnings forecasts – among the largest in a decade. As the display below illustrates, the supercharged equity returns of the mid-2000s and 2010 coincided with very rapid export growth and even stronger earnings growth. But it also shows that there just hasn’t been much export growth in nearly four years, which largely explains why earnings growth and equity returns have disappointed. Why have exports been so weak? It’s not just lower commodity prices. We’ve also seen a sharp deceleration in demand for emerging market manufactured goods from developed countries, reflecting their lethargic economies (Display).  To our thinking, however, this symbiotic relationship is the most compelling counterargument to pessimists who say that the emerging market growth story is forever broken or that globalization is over. In our view, the developing equity markets remain a levered play on the developed world recovery. Emerging world corporations still enjoy robust operating profit leverage and global trade continues to expand. Eventually, we expect global economies to pick up, which should drive demand for goods produced in developing countries. Exports will then accelerate, driving even more powerful earnings growth. Good Reasons to Maintain Exposure Today, there’s still a case for keeping exposure to emerging countries. But, in our view, that exposure should be governed by fundamental, company and country-specific insights rather than as a broad market play. Wide price gaps across country markets can set up relative valuation plays – for example, Turkey is trading at 10 times forward earnings versus 25 times for Mexico. And there are pockets of opportunity across the emerging world, which aren’t as directly affected by macroeconomic trends, such as healthcare and private education in select markets. Of course, when hunting for idiosyncratic opportunities, it is important to weigh return potential against the higher volatility that typically accompanies emerging market stocks. Our bottom line: taking advantage of emerging market opportunities no longer comes down to a simple binary decision to raise or lower allocations. It requires deeper analysis and a selective eye. The views expressed herein do not constitute research, investment advice or trade recommendations and do not necessarily represent the views of all AB portfolio-management teams. MSCI makes no express or implied warranties or representations, and shall have no liability whatsoever with respect to any MSCI data contained herein. The MSCI data may not be further redistributed or used as a basis for other indices or any securities or financial products. This report is not approved, reviewed or produced by MSCI. Morgan C. Harting is the lead Portfolio Manager for all Multi-Asset Income strategies at AllianceBernstein.

Building The Core With Vanguard: Domestic Bonds

Summary Every ETF investor needs to consider what holdings will form the very core of their portfolio. For the portion relating to domestic bonds, Vanguard’s Total Bond Market ETF is a compelling choice. Also discussed are reasons every investor should consider holding bonds in their portfolio, despite what is often described as a negative current environment. For my first articles for Seeking Alpha, I decided to start simple: tackling the question of building a solid core portfolio using ETFs offered by Vanguard Funds. I started with domestic stocks featuring the Vanguard Total Stock Market ETF (NYSEARCA: VTI ). For this second article, I turn to domestic bonds, and will be featuring the Vanguard Total Bond Market ETF (NYSEARCA: BND ). Bonds? Now? Really…? This might seem an odd time to be featuring bonds. After all, interest rates are at, or close to, historical lows, and common wisdom says they are sure to rise from here. Couldn’t our time be better spent considering other options? I might best answer that question by sharing a personal observation of mine. I tend to have CNBC.com up most of the time as one of the tabs in my browser. Last July (2014), this article titled “Why a $60B fund manager is sitting on 20 percent cash,” featuring BlackRock portfolio manager Dennis Stattman, caught my eye. To explain why he was sitting on 20% cash, the article starts with this attention-grabbing quote from the fund manager: “We don’t like the bond market.” The article goes on to enumerate all of his reasons for that view. But once you got past all that, here was the part that caught my eye. His allocations were 58% in stocks, 23% in bonds , and 19% in cash. My takeaway: Regardless of his stated feelings concerning bonds, that fund manager still had some portion of his portfolio in that asset class. Here is a second point of reference to consider. This resource from Vanguard features historical returns going all the way back to 1926 for various model portfolios, in 10% intervals – ranging all the way from 100% stocks and 0% bonds to the other extreme, 0% stocks and 100% bonds. I selected two of these to look at quickly. The first, a portfolio with 100% stocks, and the second with 60% stocks and 40% bonds: I won’t belabor the points, but a couple of things jump out. On the one hand, the allocation with 40% bonds has an average annual return of 1.4% less than one with 100% stocks. On the other hand, the worst single-year loss is 26.6% as opposed to 43.1%. Depending on a vast array of variables – including the possibility of having to sell at precisely the wrong time due to personal financial circumstances – that could make a big difference. You also derive consistent income from bonds (although, admittedly, not so much at present). This can provide you with funds to reinvest in whatever asset class you wish. Putting it all together, that BlackRock investment manager, at some level, had virtually a 60/40 stock versus bond allocation, but he chose to hold 19% in cash because he “[didn’t] like the bond market.” On a personal note, at the time that this article caught my eye, my personal bond allocation was higher than his, and I actually made an adjustment to bring it more in line with what he was doing. In summary, while you may make various decisions as to their weighting , if you believe in a disciplined portfolio as opposed to market timing, bonds deserve a place. And That Brings Us To BND (Composition) What makes BND such a good ETF to serve as the core for this portion of your portfolio? I believe it boils down to two factors: Outstanding diversification Reasonable duration BND tracks the Barclays U.S. Aggregate Float Adjusted Bond Index . This includes a wide range of government, corporate, and even international dollar-denominated bonds. All are investment-grade (Moody’s rating Baa and above), meaning you are not getting into “junk bond” territory in this particular ETF. I will have more on the risk characteristics below. The fund does not actually own every constituent in the index, but rather samples the index, holding a basket of securities that approximate the full index. The latest datasheet reveals 9,330 bonds in the actual index and 7,364 in the fund itself. As featured in this introductory article , bonds have two main risks: interest rate risk and default risk. Fortunately, the information that you need to evaluate this is provided on the datasheet for any bond ETF you are likely to consider. Here is that information directly from the latest datasheet for BND: (click to enlarge) Interest Rate Risk Let’s start with interest rate risk. When it comes to a bond mutual fund or ETF, the key data point that you need to identify is the fund’s duration . Once you identity this, the general rule is simply to multiply the fund’s duration by the change in rates . In other words, if a fund has a duration of 2 years and there is a 1% upwards move in interest rates, the value of the fund is likely to decrease by 2%. This is intended to be a general guideline as opposed to a precise number, because interest rates may rise or fall by different amounts across various terms. As an example, BND holds bonds with maturities basically ranging from 1 year to 30 years. Still, this serves as a reasonable measure of the amount of risk that you are assuming. With that in mind, note the average duration of 5.6 years displayed on the datasheet for BND. Given that, a 1% increase in interest rates could lead to a temporary loss of 5.6% of principal. I say “temporary” because unless you need to sell, this is only on paper. Remember, bonds have a face value , and this is the amount the bond is ultimately worth on the date of maturity . Also, when evaluating this, perhaps against just leaving your money in cash, consider the current SEC yield (as of 6/9/15) of 2.06%. Default Risk The second main risk with bonds is default risk. This refers to the possibility that the issuer could experience financial difficulties such that they are unable to meet the obligation to pay the face value, to return the original capital invested. Fortunately, ratings agencies rate the creditworthiness of bonds on a descending scale. Even more fortunately, default data is available for each rating category, due to the Municipal Bond Fairness Act of 2008. With that in mind, here is my analysis of this risk for BND: Essentially, I started with the weightings by Moody’s rating as published on the BND datasheet. I then multiplied this by the default risk as identified in the above-linked report, to arrive at a weighted default risk. For BND, my calculation reveals a default risk of .86%. The counterpoint to that, of course, is that lower-rated bond issuers have to offer a higher coupon or interest rate to attract buyers for their bonds. So, funds have to pick a balance of risk/reward. In other words, how far down the scale of default risk are they willing to go in search of higher returns? In the case of BND, the lowest rating currently accepted in the ETF is Baa , which is defined by Moody’s as: “… judged to be medium-grade and subject to moderate credit risk and as such may possess certain speculative characteristics.” You may also note that, cumulatively, 86.2% of the fund’s securities are rated A or higher, with 63.4% in government securities, which are generally considered to be virtually free from default risk. In summary, BND is a solid core holding because of its moderate duration (5.6 years) and credit (or default) risk, due to all holdings being rated Baa and above. Costs and Expenses Similar to that of VTI, BND carries one of the lowest expense ratios in the ETF marketplace, at .07%. To that, of course, you have to add your trading commissions. Vanguard offers its own ETFs commission-free, and TD Ameritrade offers a decent selection of commission-free Vanguard ETFs. Suitability As a core holding, BND is suitable for all portfolios. Alternatives Other ETFs worth considering, particularly if your broker offers them commission-free, are the Schwab U.S. Aggregate Bond ETF (NYSEARCA: SCHZ ) and the iShares Core U.S. Aggregate Bond ETF (NYSEARCA: AGG ). SCHZ features an industry-low .05% expense ratio, and AGG comes in at .08%. However, even if your broker offers commission-free trading on one of these alternatives, I might still hold BND as a core position and use one of the commission-free options to make small incremental purchases, such as monthly or quarterly investments, adjust portfolio weighting and the like. As a Fidelity client, this is how I use BND and AGG (commission-free trading) in my own portfolio. Last-Minute Personal Comments As I complete this article, the interest rate environment continues to be volatile. If you are considering an initial investment in bonds at this point, I might offer two suggestions: Consider establishing your initial position in multiple increments – perhaps 25% at a time. In so doing, if interest rates rise and prices drop, you will gain some proportionate benefit. Of course, this means a commission on each transaction (for most of us), but the benefits may offset this. Consider using another Vanguard ETF, the Vanguard Short-Term Bond ETF (NYSEARCA: BSV ), for some portion of your position. This ETF has a duration of only 2.7 years and a current SEC yield of 1.08%. The trade-off, as you can clearly see, is a little less income in return for less downside risk. Disclosure: The author is long AGG, BND, BSV, VTI. (More…) The author wrote this article themselves, and it expresses their own opinions. The author is not receiving compensation for it (other than from Seeking Alpha). The author has no business relationship with any company whose stock is mentioned in this article. Additional disclosure: I am not a registered investment advisor or broker/dealer. Readers are advised that the material contained herein should be used solely for informational purposes, and to consult with their personal tax or financial advisors as to its applicability to their circumstances. Investing involves risk, including the loss of principal.

CenterPoint Energy: Houston’s Not So Bad

Long/short equity, value, research analyst, growth at reasonable price “}); $$(‘#article_top_info .info_content div’)[0].insert({bottom: $(‘mover’)}); } $(‘article_top_info’).addClassName(test_version); } SeekingAlpha.Initializer.onDOMLoad(function(){ setEvents();}); Summary Heavily Houston-focused profit center, accounting for two-thirds of total operating income. Electricity demand fears for the area may be overdone. 3%-4% earnings and cashflow growth FY’15-17 would support equivalent dividend growth rate. DCF valuation suggests value of $24.50 per share. CenterPoint Energy’s (NYSE: CNP ) primary business focus is around the Houston area, which along with the downturn in the Oil & Gas industry, are two issues weighing heavily on CNP’s share price. Demand may be more resilient than what investors expect. However, even a 3%-4% earnings and cash flow CAGR outlook will support an equivalent dividend growth rate. The prospective dividend yield of nearly 5% looks attractive, with CNP yielding over 100 bps more than its peers. Income investors should start to circle. Houston-focused business activities delivered two-thirds of operating income last year CNP’s Houston-focused electrical transmission and distribution business delivered around two-thirds of the company’s total operating income in FY’14. Because of this, concerns around job losses in the area and the sharp downturn in the oil & gas industry have impacted sentiment in the CNP share price. That said, the CNP management team believes that Houston’s Head-office status, as opposed to Operating company status, could leave it more resilient to job cuts and thus electricity demand than the stock market believes. Q1-15 customer growth rate of 2% supports this theory. Utility Rate Relief possible in H2-15, one of two possible share price catalysts CNP’s Natural Gas Utilities have filed this year for a combined $20 million rate increase via four recovery mechanisms and one rate case, each with expected 2H-15 effective dates. Management also plans to file rate cases in Minnesota and Arkansas in 2H-15. Management spoke constructively of recent regulatory reform in Arkansas that is expected to reduce the regulatory lag going forward. News on this could act as a share price catalyst along with clarity on the long-term dividend growth outlook. Management has promised to update investors on this in August. DCF methodology suggests value of $24.50 per share My DCF model suggests an implied fair value of $24.50 per share based on conservative assumptions. There are also two possible share price catalysts looming and the stock dividend yielding around 5% on a prospective basis. I think that CNP is worth a second look. Disclosure: The author has no positions in any stocks mentioned, but may initiate a long position in CNP over the next 72 hours. (More…) The author wrote this article themselves, and it expresses their own opinions. The author is not receiving compensation for it (other than from Seeking Alpha). The author has no business relationship with any company whose stock is mentioned in this article. Share this article with a colleague