Tag Archives: current

3 Looks At Current Market Multiples

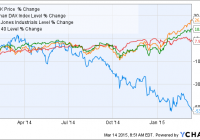
Summary The S&P 500 has come of its all-time high, down 9% from its May peak. This article puts the current level in historical context by examining three different earnings multiples. Trailing 1-year earnings, estimated forward 1-year earnings, and a measure of cyclically-adjusted price/earnings are used to frame the current market level. I leave readers with three takeaways on my views of this data. When the S&P 500 (NYSEARCA: SPY ) was hitting new all-time highs in early 2015, I authored an article entitled ” A View From the Top: 3 Looks at Market Multiples “. Given the recent market pullback, this article reprises these different views to put the market drawdown in context. This article looks at the current price level of the index via three different measures: 1) a historical examination of the index relative to trailing one-year earnings; 2) a historical examination of the index relative to forward one-year earnings; and, 3) a historical examination of the cyclically adjusted price earnings multiple. (Source: Standard and Poor’s; Bloomberg) The graph above shows the most commonly cited earnings multiple, the Price/Earnings (P/E) ratio, which shows the index level relative to trailing one-year earnings. When I wrote a version of this article in February, the market was valued at roughly eleven percent more than its average since the broad market gauge went to its current five-hundred constituent form in 1957. With the recent pullback, we are trading at just a 1.6% premium to the market’s historical multiple. (Source: Standard and Poor’s; Bloomberg) The second graph shows the current index level relative to a best estimate of forward earnings from Bloomberg. Based on the current expectation of continued strong growth in earnings, the index is valued at 16.2x forward earnings. In February, this valuation was 6.5% greater than the trailing 25-year average, which is the extent of the ratio history available on Bloomberg. Today, the market is actually trading at a small discount of 2.7% relative to this historical valuation multiple. (click to enlarge) (Source: Robert Shiller ) While we often talk about valuation relative to trailing or forward one-year earnings, as we did in the previous two sections, examining the index level relative to earnings over a length of time more consistent with an entire business cycle can be viewed as more appropriate. Above is a version of Yale economics professor and Nobel laureate Robert Shiller’s cyclically adjusted price-to-earnings ratio (CAPE or Shiller P/E), a valuation measure applied to the equity market that divides the price level of the index by the average of ten years of earnings, adjusted for inflation. With the index multiple now roughly equivalent to the post-crisis market peak in 2007, and trailing only the historic bubbles in 1929 and 2000, the CAPE is the most oft-cited reason for lowered forward return expectations in the domestic equity market. The current multiple is 46% above its trailing 144-year average. Three takeaways: When I wrote a version of this article in early 2015, the valuations looked stretched by all three measures. In my article, ” 10 Themes Shaping Markets in 2015 “, I wrote: “Stretched equity multiples domestically will necessitate that valuations be driven by changes in earnings, tempering further price gains”. Well, we have not received price gains, with the S&P 500 producing a -6.7% return in 2015. This reduction in the index level has outpaced lower earnings from the commodity-sensitive sectors of the market, making the current market valuation appear more fair. Low interest rates have contributed to higher market multiples. In the CAPE graph above, notice that the market multiple moves inversely to the long-term interest rate level. With interest rates in the U.S. again rallying with increased macro volatility, market multiples have expanded. I covered this relationship in the 2012 article, ” Equity Multiples and Interest Rates: Is the Current Risk Premium Sufficient? ” Common stock valuation techniques include discounting future earnings back to the present, which demonstrates why lower (higher) interest rates would be consistent with a higher (lower) equity multiples. Low interest rates and near-zero short-term interest rates have pushed investors from cash and fixed income into more risky asset classes, which has also driven equity multiples higher. As rates began selling off in the taper tantrum in mid-2013, it felt like rate-driven equity gains could be peaking. With long Treasuries again rallying, and the Fed signaling to the market that they are likely to move slowly even if they move the Fed Funds rate higher, perhaps this upward pressure on valuations could stick around. 16.5 still looks to be a magic number. In all three of these valuation measures, which feature different perspectives and time horizons, the average market multiple has been around 16.5x (16.19x forward earnings multiple; 16.63x CAPE; 16.96x trailing earnings multiple). Over extended time horizons, elevated earnings multiples above 16.5x are going to be consistent with below-average forward returns. Conclusion In February, these three multiples signaled that the market was rich. After our first correction in several years, the valuations now appear more fair, although the CAPE multiple is still historically elevated. Shortening the lookback period in the CAPE multiple from ten years to five years strips out the 2008-2009 downturn, and the multiple is just 28% above its historical average. Readers must ascertain whether they believe that a proper risk premium is being reflected in this market valuation, and where they believe earnings growth is headed in the context of their own risk tolerance and portfolio construction. Disclosure: I am/we are long SPY. (More…) I wrote this article myself, and it expresses my own opinions. I am not receiving compensation for it (other than from Seeking Alpha). I have no business relationship with any company whose stock is mentioned in this article.

The Greek Share Market: Poised For Significant Gains, After The Situation Calms Down

Summary The Global X FTSE Greece 20 ETF has declined by more than 50% since the beginning of 2014. The Greek government seems to understand the negative impacts of the potential grexit and they will have to fulfill the conditions of their Eurozone partners in the end. The Greek share market will grow significantly after the current problems are resolved. The growth will be strengthened by the European QE. The Greek share market represented by the Global X FTSE Greece 20 ETF (NYSEARCA: GREK ) has declined by more than 50% since the beginning of 2014. A major part of the decline happened in the second half of 2014 and in 2015 and it was caused by the renewed concerns about the potential grexit. The GREK share price behaved in line with the major markets (chart below) from the beginning. The problems started during the summer months and culminated in December and January when a political crisis led to early elections. The elections were won by Syriza, a party with a strong and loud anti-austerity rhetoric. Their way to power was paved by refusing the austerity measures and by a lot of unrealistic promises to the electorate. The new Greek government, led by prime minister Alexis Tsipras, initially demanded another debt writedown as well as a renegotiation of terms of the bailout program. After four weeks full of furious negotiations and a free fall of the Greek financial markets, the Greek government promised reforms, promised that it will not introduce any unilateral measures that would negatively impact the fiscal targets set by the “troika” and it declared its intention to fulfill its financial obligations. As a result, the bailout program should be extended by another four months. But a new list of reforms must be accepted by the Eurozone finance ministers before another financial aid disbursement. The proposed reforms were rejected by the Eurozone partners on March 9 and there is a threat of a Greek default as soon as this month. Although the initial reaction of the Greek representatives was highly negative, ranging from demands for German war reparations to threats of flooding Europe with immigrants. But on Friday, Tsipras reassured that Greece will hold its word given in February. It is more evidence that the Greek government realizes the painful consequences of the potential grexit. All the screaming and kicking around is just theatre for the Greek electorate. The grexit and the Greek default would lead to an immediate decline of the purchasing power of Greek citizens. The unemployment rate would grow above the current 25% level and the bank sector would be on the brink of a total collapse. Any chances of the current Greek government for a future re-election would drop to values close to zero. Yes, the grexit could be positive for Greece from a long term point of view. But the long term positives are not a sure thing. The only sure thing is huge pain in the short term. The most probable scenario is that the Greek government will keep on screaming and kicking, so that it can show their voters that they want to keep their promises and they fight for Greece, but they will surrender in the end in order to avoid the grexit and the responsibility for it. The Eurozone partners may make some minor compromises in order to give Syriza an opportunity to show their voters some “success”. But any major reliefs are highly improbable. The economy of the Eurozone is stronger than in 2012 and what is more important, the European financial sector is much better prepared for a potential grexit. The grexit is a much bigger threat for Greece than for the Eurozone today. As I wrote above, I expect that the situation will calm down and Greece will stay in the Eurozone. This is why I see a huge investment opportunity in Greek shares. As the chart below shows, GREK increased rapidly after its bottom in May 2012. It grew from $8.85 on June 1, 2012, to $18.80 on October 22, 2012. That’s more than 100% in less than five months. Yes, the historical results are no guarantee of future results, but history tends to repeat itself. Moreover, there is another powerful card in play this time. The European QE. The QEs led to inflation of a share market bubble in the USA. The same process has started in Europe now. And a lot of investors will direct their money into cheap Greek shares, after the situation around Greece calms down a little. I admit, I have no idea where the bottom will be and when it will come. It is possible that GREK will retest the 2012 lows in the coming weeks and it is possible that the bottom is somewhere near the current price level. Everything will depend on the progress of the Eurozone – Greece negotiations. The longer the negotiations last, the more the market’s nervousness will grow and the lower GREK will fall. The best solution is to wait until any kind of solution is reached and initiate a position in GREK. It may mean buying shares 10% or 20% above the bottom, but there will likely still be a huge upside remaining. Conclusion Although the Greek government is very loud and very aggressive, Tsipras seems to realize the negative impacts of the grexit on Greece and the future political careers of him and his party. I believe that Greece will surrender and fulfill the demands of its partners. In this case we can expect a huge increase of the GREK share price. It increased by more than 100% in less than five months, back in 2012. Similar gains are possible this time, given the supporting effects of the European QE. The best way to play this situation is to wait until the current complications between Greece and its Eurozone partners are resolved and initiate a long position. It may mean losing some initial gains of the bull run, but there should be still more than enough profits left. Disclosure: The author has no positions in any stocks mentioned, and no plans to initiate any positions within the next 72 hours. (More…) The author wrote this article themselves, and it expresses their own opinions. The author is not receiving compensation for it (other than from Seeking Alpha). The author has no business relationship with any company whose stock is mentioned in this article.