Tag Archives: author

Riskier Bond ETFs For A More Dovish Fed Outlook

By Max Chen and Tom Lydon With the Federal Reserve holding interest rates and only anticipating two rate hikes this year, fixed-income investors may turn to riskier debt securities and related exchange traded funds, reports industry analyst ETF Trends . The Fed’s dovish stance sent the U.S. dollar retreating, with the Dollar Index down about 1.9% since the Fed’s Wednesday announcement. “Any weakening of the U.S. dollar will support emerging markets that have issued U.S. denominated debt and will take pressure off of China’s need to manage their currency,” Matthew Whitbread, investment manager at Baring Asset Management, said on CNBC . “This would bode well for investors able to allocate to select emerging market currencies and local bond markets.” Fixed-income investors may gain exposure to U.S. dollar-denominated emerging market debt through ETF options. For instance, the iShares J.P. Morgan USD Emerging Markets Bond ETF (NYSEARCA: EMB ) has a 7.01 year duration and a 5.30% 30-day SEC yield. The PowerShares Emerging Markets Sovereign Debt Portfolio (NYSEARCA: PCY ) has a 8.34 year duration and a 5.90% 30-day SEC yield. The Vanguard Emerging Markets Government Bond ETF (NASDAQ: VWOB ) has a 6.2 year duration and a 4.95% 30-day SEC yield. Year-to-date, EMB rose 3.9%, PCY gained 3.6% and VWOB returned 3.4%. Additionally, with emerging market currencies appreciating against the greenback, local-currency emerging market bond ETFs have also been outperforming. For local currency-denominated emerging market bond ETFs, the iShares Emerging Markets Local Currency Bond ETF (NYSEARCA: LEMB ) has a 4.77 year duration and a 4.73% 30-day SEC yield. The Market Vectors Emerging Markets Local Currency Bond ETF (NYSEARCA: EMLC ) has a 4.76 year duration and a 5.95% 30-day SEC yield. The actively managed WisdomTree Emerging Markets Local Debt Fund (NYSEARCA: ELD ) has a 5.01 year duration and a 5.89% 30-day SEC yield. Year-to-date, LEMB increased 3.7%, EMLC advanced 6.6% and ELD gained 5.3%. “Overall, a more dovish Fed should support risky assets, in particular high yield credit that benefits both from falling yields as well as economic growth,” Whitbread added. For instance, over the past two days, the SPDR Barclays High Yield Bond ETF (NYSEARCA: JNK ) was up 1.7% and the iShares iBoxx $ High Yield Corporate Bond ETF (NYSEARCA: HYG ) was 1.2% higher. JNK has a 4.26 year duration and a 7.28% 30-day SEC yield. HYG has a 4.01 year duration and a 7.26% 30-day SEC yield. Disclosure: I/we have no positions in any stocks mentioned, and no plans to initiate any positions within the next 72 hours. I wrote this article myself, and it expresses my own opinions. I am not receiving compensation for it. I have no business relationship with any company whose stock is mentioned in this article.
The Benefits Of Currency-Hedged International ETFs

By Max Chen and Tom Lydon Currency-hedged exchange traded funds have become a popular way to access international markets while hedging currency risks. While some may be concerned about the costs of implementing these currency hedges, the benefits have outweighed the costs, reports ETF Trends . For developed international market exposure, investors have turned to broad EAFE – developed Europe, Australasia and Far East – Index ETFs, like the iShares MSCI EAFE ETF (NYSEArca: EFA ) and Vanguard FTSE Developed Markets ETF (NYSEArca: VEA ) . However, when accessing overseas markets, investors will be exposed to currency risks – a strengthening U.S. dollar or weakening foreign currency diminishes international equity returns. Alternatively, investors may look at a number of currency-hedged international ETF options to capture foreign exposure while hedging currency risks, such as the Deutsche X-trackers MSCI EAFE Hedged Equity ETF (NYSEArca: DBEF ) , which utilize currency forward contracts to diminish the negative effects of weaker foreign currencies. Some may be concerned about the costs to implement the hedging strategy, especially as fund managers sell a foreign currency forward at a different rate to where the spot rate is. Investors typically bear a hedging cost when the interest rate is higher on a foreign currency than it is on the U.S. dollar, Deutsche Asset Management strategists Abby Woodman, Dodd Kittsley and Robert Bush said in a research note. On the other hand the opposite is also true. When U.S. rates are higher than foreign ones, hedging becomes a net benefit for U.S. investors as there is a “positive cost of carry.” “For many currencies today, including the euro, pound, yen and Swiss franc, one-month interest rates are lower than they are for the U.S. dollar, resulting in a hedging ‘benefit’ to U.S.-based investors removing their international foreign exchange (NYSE: FX ) exposures,” Deutsche strategists said. Looking at DBEF’s underlying MSCI EAFE currencies, we see that that five of the 12 developed market currencies show negative one-month deposit rates, including a -0.17% rate for the euro, which makes up 30.4% of the EAFE index, a -0.21% rate on the Japanese yen, which is 24.2% of the index, and -0.74% rate on the Swiss franc, which is 9.3% of the benchmark. More importantly, most foreign currency rates to the USD show a positive spread – the U.S. dollar rate is higher than the foreign rates, which provides a positive cost to carry, or a benefit, for hedged investors. Specifically, among the top four currency exposures, which make up 83% of the EAFE Index’s weighting, the EUR shows a +0.70% spread to USD, JPY shows a +0.74% spread to the USD, the GBP has a +0.03% spread to the USD and the CHF has a +1.27% spread to the USD. “Anytime the U.S. dollar rate is higher than the foreign rate (the ‘Spread to USD’ row is positive) then there will be a positive cost of carry,” the Deutsche strategists added. “Or, to put it another way, the investor gets paid to hedge.” Currently, investors with currency-hedged developed EAFE market exposure are receiving a positive cost of carry from each of the four biggest currencies in the international basket. Deutsche X-trackers MSCI EAFE Hedged Equity ETF Click to enlarge Disclosure: I/we have no positions in any stocks mentioned, and no plans to initiate any positions within the next 72 hours. I wrote this article myself, and it expresses my own opinions. I am not receiving compensation for it. I have no business relationship with any company whose stock is mentioned in this article.

Does Market Volatility Favor Active Management?

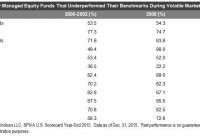
By Aye Soe Twice a year, S&P Dow Jones Indices releases the SPIVA U.S. Scorecard. The scorecard measures the performance of actively managed equity and fixed income funds across various categories. Since the initiation of the report in 2002, the results have consistently shown that managers across most categories overwhelmingly underperform on a relative basis against their corresponding benchmarks over a medium-to-long-term investment horizon. The Year-End 2015 SPIVA U.S. Scorecard reveals little surprise. The second half of 2015 was marked by significant market volatility, which was brought forth by plunging commodity prices, a strengthening U.S. dollar, growing global concerns over Chinese economic growth, and the subsequent devaluation of the Chinese renminbi. Market volatility, in theory, favors active investing, because managers can tactically move out of their positions at their discretion and park themselves in cash. Passive investing, on the other hand, has to remain fully invested in the market. Investors in actively managed strategies should therefore realize fewer losses during periods of heightened volatility, all else being equal. Given this theoretical background, recent volatility in the market has supporters of active investing proclaiming that active management is back in favor. However, over a decade of experience in publishing the SPIVA Scorecard has painfully taught us that active funds don’t always perform better than their passive counterparts during those precise periods in which active management skills seem to be called for. Exhibit 1 compares the performance of actively managed equity funds across the nine style boxes during the 2000-2002 bear market, the financial crisis of 2008, and 2015. As the data clearly show, there is no consistent pattern across most of the categories. Large-cap value managers appear to be the only exception to the losing trend, outperforming their benchmark in both bear markets. Again in 2015, mid-cap value is the only winning equity category, with the majority (67.65%) of them outperforming the S&P MidCap 400® Value . Disclosure: © S&P Dow Jones Indices LLC 2015. Indexology® is a trademark of S&P Dow Jones Indices LLC (SPDJI). S&P® is a trademark of Standard & Poor’s Financial Services LLC and Dow Jones® is a trademark of Dow Jones Trademark Holdings LLC, and those marks have been licensed to S&P DJI. This material is reproduced with the prior written consent of S&P DJI. For more information on S&P DJI and to see our full disclaimer, visit www.spdji.com/terms-of-use .