Scalper1 News
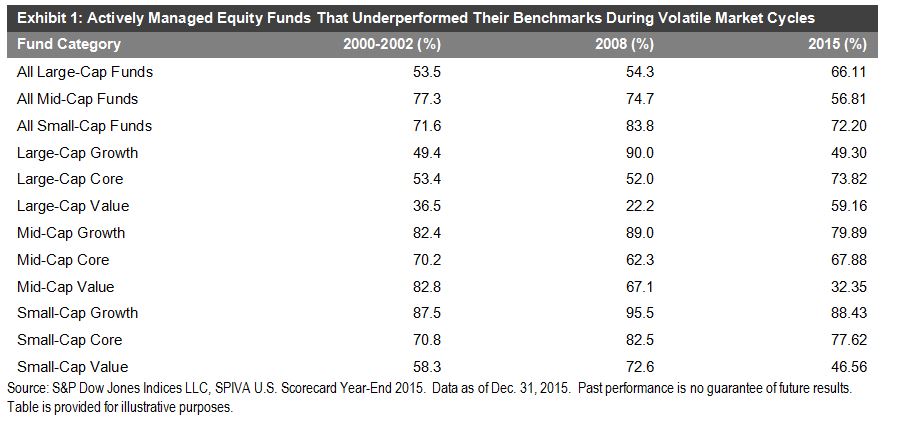
 By Aye Soe Twice a year, S&P Dow Jones Indices releases the SPIVA U.S. Scorecard. The scorecard measures the performance of actively managed equity and fixed income funds across various categories. Since the initiation of the report in 2002, the results have consistently shown that managers across most categories overwhelmingly underperform on a relative basis against their corresponding benchmarks over a medium-to-long-term investment horizon. The Year-End 2015 SPIVA U.S. Scorecard reveals little surprise. The second half of 2015 was marked by significant market volatility, which was brought forth by plunging commodity prices, a strengthening U.S. dollar, growing global concerns over Chinese economic growth, and the subsequent devaluation of the Chinese renminbi. Market volatility, in theory, favors active investing, because managers can tactically move out of their positions at their discretion and park themselves in cash. Passive investing, on the other hand, has to remain fully invested in the market. Investors in actively managed strategies should therefore realize fewer losses during periods of heightened volatility, all else being equal. Given this theoretical background, recent volatility in the market has supporters of active investing proclaiming that active management is back in favor. However, over a decade of experience in publishing the SPIVA Scorecard has painfully taught us that active funds don’t always perform better than their passive counterparts during those precise periods in which active management skills seem to be called for. Exhibit 1 compares the performance of actively managed equity funds across the nine style boxes during the 2000-2002 bear market, the financial crisis of 2008, and 2015. As the data clearly show, there is no consistent pattern across most of the categories. Large-cap value managers appear to be the only exception to the losing trend, outperforming their benchmark in both bear markets. Again in 2015, mid-cap value is the only winning equity category, with the majority (67.65%) of them outperforming the S&P MidCap 400® Value . Disclosure: © S&P Dow Jones Indices LLC 2015. Indexology® is a trademark of S&P Dow Jones Indices LLC (SPDJI). S&P® is a trademark of Standard & Poor’s Financial Services LLC and Dow Jones® is a trademark of Dow Jones Trademark Holdings LLC, and those marks have been licensed to S&P DJI. This material is reproduced with the prior written consent of S&P DJI. For more information on S&P DJI and to see our full disclaimer, visit www.spdji.com/terms-of-use . Scalper1 News
Scalper1 News