Tag Archives: author

ETFReplay.com Portfolio Update

The ETFReplay.com Portfolio holdings have been updated for February 2015. I previously detailed here and here how an investor can use ETFReplay.com to screen for best performing ETFs based on momentum and volatility. The portfolio begins with a static basket of 14 ETFs. These 14 ETFs are ranked by 6 month total returns (weighted 40%), 3 month total returns (weighted 30%), and 3 month price volatility (weighted 30%). The top 4 are purchased at the beginning of each month. When a holding drops out of the top 5 ETFs it will be sold and replaced with the next highest ranked ETF. The 14 ETFs are listed below: Symbol Name RWX SPDR DJ International Real Estate PCY PowerShares Emerging Mkts Bond WIP SPDR Int’l Govt Infl-Protect Bond EFA iShares MSCI EAFE HYG iShares iBoxx High-Yield Corp Bond EEM iShares MSCI Emerging Markets LQD iShares iBoxx Invest Grade Bond VNQ Vanguard MSCI U.S. REIT TIP iShares Barclays TIPS VTI Vanguard MSCI Total U.S. Stock Market DBC PowerShares DB Commodity Index GLD SPDR Gold Shares TLT iShares Barclays Long-Term Trsry SHY iShares Barclays 1-3 Year Treasry Bnd Fd In addition, ETFs must be ranked above the cash-like ETF SHY in order to be included in the portfolio, similar to the absolute momentum strategy I profiled here . This modification could help reduce drawdowns during periods of high volatility and/or negative market conditions (see 2008-2009), but it could also reduce total returns by allocating to cash in lieu of an asset class. The top 5 ranked ETFs based on the 6/3/3 system as of 1/31/15 are below: 6mo/3mo/3mo LQD iShares iBoxx Invest Grade Bond VNQ Vanguard MSCI U.S. REIT TLT iShares Barclays Long-Term Trsry TIP iShares Barclays TIPS SHY Barclays Low Duration Treasury Since all of the current holdings are still ranked in the top 5 there is no turnover this month. In 2014 I introduced a pure momentum system, which ranks the same basket of 14 ETFs based solely on 6 month price momentum. There is no cash filter in the pure momentum system, volatility ranking, or requirement to limit turnover – the top 4 ETFs based on price momentum will be purchased each month. The portfolio and rankings will be posted on the same spreadsheet as the 6/3/3 strategy. The top 4 six month momentum ETFs are below: 6 month Momentum TLT iShares Barclays Long-Term Trsry VNQ Vanguard MSCI U.S. REIT LQD iShares iBoxx Invest Grade Bond VTI Vanguard Total U.S. Stock Market The top 4 ETFs are the same as last months, so there is no turnover for February. Disclosures: None How did this change your view of ? More Bullish More Bearish It Didn’t This impact ( ) More Bullish More Bearish Unchanged Thanks for sharing your thoughts. Submit & View Results Skip to results » Share this article with a colleague

Complete List Of 79 ETP Closures For 2014

Seventy-nine exchange traded products bit the dust in 2014, marking the second highest annual death toll in the history of the ETF industry. The 72 ETF and 7 ETN closures were second only to the 102 closures of 2012. Broken down by major categories, the closures of 2014 consisted of 22 sector, 15 style and strategy, 14 global and international, 13 bond, 7 inverse, 4 leveraged, and 4 commodity. Of the 2,121 U.S. ETPs launched since the dawn of the industry in 1993, only 1,662 remain listed while 459 have closed. Said another way, the historic probability of ETP survivability is 78.4%. Closures affected 15 brands and sponsors in 2014. Pax World was the only sponsor to exit the ETF space completely, and it did so in a very strange fashion. ETF pundits have long discussed the possibility of a large quantity of mutual funds converting to ETFs. However, no one ever thought conversions might go the other direction, but that is exactly what happened when all $64 million of the assets in the Pax MSCI EAFE ESG Index ETF (NYSEARCA: EAPS ) suddenly became Institutional Class shares of the Pax World International ESG Index Fund (MUTF: PXNIX ), a traditional mutual fund. See ‘ This Wasn’t Supposed To Happen: ETF Converts To Mutual Fund ‘ for additional details. Goldman Sachs is highly regarded on Wall Street, and it is often thought of as a firm that can do no wrong when it comes to making money. However, it hasn’t figured out the ETF space yet. Goldman (NYSE: GS ) attached its name and investment strategies to four ETFs sponsored by ALPS in 2012. Apparently, the Goldman name carries no weight in ETF land , and all four ETFs closed in 2014 with combined assets of less than $11 million. For a number of reasons, the most notable closures of the year belong to iShares. First, 29 iShares ETFs had their last day of listed trading in 2014, giving iShares a 37% market share of closures. No other brands came close to this figure, with Direxion and EGShares tying for second-place “honors” with just six closures each. Second, iShares raised the bar on ETF survivability , as its 18 closings in October averaged more than $18 million in assets and two had about $70 million each. At the time, 49% of all listed ETFs and ETNs had fewer assets. Third, two of the liquidated funds (NY and NYC) had been on the market more than ten years. Longevity does not assure survival. Last, I can recall a BlackRock (NYSE: BLK ) representative questioning why there were iShares funds on ETF Deathwatch when none had ever closed. I reminded him that iShares practically invented ETF closures with three such occurrences in 2002. He rebutted that Barclays owned the iShares brand at that time, and BlackRock had never closed an ETF. Never say never. Some ETPs have maturation dates, namely target-date maturity bond ETFs and all ETNs. At their time of launch, these products inform investors of their likely closure and liquidation dates. For example, the Guggenheim BulletShares series of target maturity bond ETFs retire a couple of funds at the end of each calendar year. The two 2014 BulletShares ETFs (BSCE and BSJE) had their last day of trading on December 30, and next year we can expect the 2015 funds (BSCF and BSJF) to do the same. These are planned from the time of inception and are not indicative of unhealthy or failing products. Every ETN is also issued with a maturity date. Typically, ETNs are launched with 30-year or 20-year maturities. Since the first ETNs didn’t come to market until 2006, most investors thought they wouldn’t have to deal with ETN maturation for another 10 or 20 years. However, in 2009 there were five ETNs issued as 5-year notes scheduled to mature in 2014. Three of these five triggered early terminations, including Barclays ETN+ S&P 500 Short B ETN (NYSEARCA: BXDB ) last April. The two that escaped early termination, BXUC and BXUB, matured in November and were liquidated. Most of 2014’s closures had become Zombie ETFs, and 58 of the 79 (73%) were on ETF Deathwatch at the time of their closure announcements. The major exceptions included the maturing products discussed above and many of the iShares with large amounts of assets. The average age of funds that closed in 2014 was 45.8 months (3.8 years). This is greater than the 31.4-month average lifespan of all 459 closed products, suggesting sponsors are willing to subsidize these non-profitable products longer than in years past. The table below is currently sorted by product name. # Ticker Name Last Day Deathwatch Notes 1 GSAX ALPS/GS Momentum Builder Asia x-Japan Eq/US-T 08/27/2014 Yes 2 GSGO ALPS/GS Momentum Builder Growth Markets Eq/US-T 08/27/2014 Yes 3 GSMA ALPS/GS Momentum Builder Multi-Asset 08/27/2014 Yes 4 GSRA ALPS/GS Risk-Adjusted Return U.S. Large Cap 08/27/2014 Yes 5 BXUB Barclays ETN+ S&P 500 Long B Leveraged ETN 11/20/2014 Yes 2 6 BXUC Barclays ETN+ S&P 500 Long C Leveraged ETN 11/20/2014 – 2 7 BXDB Barclays ETN+ S&P 500 Short B Leveraged ETN 04/10/2014 Yes 3 8 BRZS Direxion Daily Brazil Bear 3x Shares 09/23/2014 Yes 9 EURZ Direxion Daily FTSE Europe Bear 3x Shares 09/23/2014 Yes 4 10 BARS Direxion Daily Gold Bear 3x Shares 12/26/2014 Yes 4 11 JPNS Direxion Daily Japan Bear 3x Shares 09/23/2014 Yes 12 GASX Direxion Daily Natural Gas Related Bear 3x 09/23/2014 – 13 KORZ Direxion Daily South Korea Bear 3x Shares 09/23/2014 Yes 14 CHXX EGShares China Infrastructure 09/29/2014 Yes 15 EMDG EGShares Emerging Markets Dividend Growth 12/24/2014 Yes 16 EMHD EGShares Emerging Markets Dividend High Income 12/24/2014 Yes 17 IEMF EGShares TCW EM Intermediate Term IG Bond 09/29/2014 Yes 4 18 LEMF EGShares TCW EM Long Term IG Bond 09/29/2014 Yes 4 19 SEMF EGShares TCW EM Short Term IG Bond 09/29/2014 Yes 4 20 OFF ETRACS Fisher-Gartman Risk Off ETN 05/18/2014 Yes 21 ONN ETRACS Fisher-Gartman Risk On ETN 05/18/2014 Yes 22 GASZ ETRACS Natural Gas Futures Contango ETN 01/22/2014 – 23 OILZ ETRACS Oil Futures Contango ETN 01/22/2014 Yes 24 CNPF Global X Canada Preferred 10/16/2014 Yes 25 GGGG Global X Pure Gold Miners 10/16/2014 Yes 26 BSCE Guggenheim BulletShares 2014 Corp Bond 12/30/2014 – 2 27 BSJE Guggenheim BulletShares 2014 HY Corp Bond 12/30/2014 – 2 28 GIY Guggenheim Enhanced Core Bond 03/07/2014 Yes 1 29 MUAC iShares 2014 AMT-Free Muni Term 08/15/2014 – 2 30 NUCL iShares Global Nuclear Energy 10/14/2014 Yes 31 FNIO iShares Industrial/Office Real Estate Capped 10/14/2014 Yes 32 AXDI iShares MSCI ACWI ex US Consumer Discretionary 03/25/2014 Yes 33 AXSL iShares MSCI ACWI ex US Consumer Staples 03/25/2014 Yes 34 AXEN iShares MSCI ACWI ex US Energy 03/25/2014 Yes 35 AXFN iShares MSCI ACWI ex US Financials 03/25/2014 Yes 36 AXHE iShares MSCI ACWI ex US Healthcare 03/25/2014 Yes 37 AXID iShares MSCI ACWI ex US Industrials 03/25/2014 Yes 38 AXIT iShares MSCI ACWI ex US Information Technology 03/25/2014 Yes 39 AXMT iShares MSCI ACWI ex US Materials 03/25/2014 Yes 40 AXTE iShares MSCI ACWI ex US Telecom Services 03/25/2014 Yes 41 AXUT iShares MSCI ACWI ex US Utilities 03/25/2014 Yes 42 EMFN iShares MSCI Emerging Markets Financials 10/14/2014 Yes 43 EMMT iShares MSCI Emerging Markets Materials 10/14/2014 Yes 44 FEFN iShares MSCI Far East Financials 10/14/2014 Yes 45 NY iShares NYSE 100 ETF 10/14/2014 – 46 NYC iShares NYSE Composite ETF 10/14/2014 – 47 RTL iShares Retail Real Estate Capped 10/14/2014 Yes 48 TZD iShares Target Date 2010 10/14/2014 – 49 TZE iShares Target Date 2015 10/14/2014 – 50 TZG iShares Target Date 2020 10/14/2014 – 51 TZI iShares Target Date 2025 10/14/2014 – 52 TZL iShares Target Date 2030 10/14/2014 – 53 TZO iShares Target Date 2035 10/14/2014 – 54 TZV iShares Target Date 2040 10/14/2014 – 55 TZW iShares Target Date 2045 10/14/2014 Yes 56 TZY iShares Target Date 2050 10/14/2014 – 57 TGR iShares Target Date Retirement Income 10/14/2014 – 58 RKH Market Vectors Bank and Brokerage 12/12/2014 Yes 59 COLX Market Vectors Colombia 12/12/2014 Yes 60 GERJ Market Vectors Germany Small-Cap 12/12/2014 Yes 61 LATM Market Vectors Latin America Small-Cap 12/12/2014 Yes 62 CHLC Market Vectors Renminbi Bond 12/12/2014 Yes 63 EAPS Pax MSCI EAFE ESG Index ETF 03/21/2014 – 5 64 AUD PIMCO Australia Bond Index 09/26/2014 – 65 TRSY PIMCO Broad U.S. Treasury Index 03/10/2014 Yes 66 BABZ PIMCO Build America Bond 09/26/2014 – 1 67 CAD PIMCO Canada Bond Index 09/26/2014 – 68 BUND PIMCO Germany Bond Index 09/26/2014 Yes 69 PIQ PowerShares Dynamic Magniquant 02/18/2014 Yes 70 KBWX PowerShares KBW International Financial 02/18/2014 Yes 71 PXN PowerShares Lux Nanotech 02/18/2014 Yes 72 PMNA PowerShares MENA Frontier Countries 02/18/2014 Yes 73 GEMS PureFunds ISE Diamonds/Gemstone 01/23/2014 Yes 74 MSXX PureFunds ISE Mining Service 01/23/2014 Yes 75 NAGS Teucrium Natural Gas 12/18/2014 Yes 76 CRUD Teucrium WTI Crude Oil 12/18/2014 Yes 77 ASDR VelocityShares Emerging Asia DR ETF 11/20/2014 Yes 78 EMDR VelocityShares Emerging Markets DR ETF 11/20/2014 Yes 79 RUDR VelocityShares Russia DR ETF 11/20/2014 Yes Notes: 1) actively managed, 2) reached planned maturity, 3) hit early termination trigger, 4) launched in 2014 and less than 1 year old at time of closure, 5) converted to mutual fund. All exchange traded notes are identified with “ETN” as part of their name description. Disclosure covering writer, editor, publisher, and affiliates: No positions in any of the securities mentioned. No positions in any of the companies or ETF sponsors mentioned. No income, revenue, or other compensation (either directly or indirectly) received from, or on behalf of, any of the companies or ETF sponsors mentioned.

Between The U.S. Economic Recovery And Global Slowdown There Is GLD

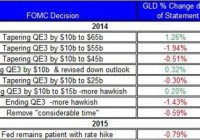
Summary The FOMC is still likely to raise rates in the coming months, but the global economic slowdown could still keep up GLD. I reexamine the relation between GLD and the U.S. dollar. The upcoming non-farm payroll report could bring GLD further down. The FOMC’s recent meeting was concluded with no changes to policy. The statement presented modest changes to the wording. For now, the market still estimates a rate hike in the middle of year. Following this news, the price of the SPDR Gold Trust (NYSEARCA: GLD ) fell down albeit it’s still up for the year. Let’s review the latest from the FOMC, the upcoming reports to be released this week, and reexamine the relation between the U.S. dollar and gold in light of the global economic slowdown. Last week’s main event was the FOMC meeting , in which the FOMC tried not to “rock the boat” and provided little changes in the wording in the statement. Nonetheless, following the release of the FOMC statement, the price of GLD took another tumble. (click to enlarge) Source of data taken from FOMC’s site and Bloomberg The statement still suggested that FOMC remains bullish on the U.S. economy, which isn’t a good sign for keeping rates low for a long time. The recent release of the U.S. GDP , in which the GDP growth rate for the fourth quarter was only 2.6%, market expectations were at 3% and in the third quarter the GDP grew by 5% may have contributed to the rally of GLD on Friday. A closer look at this report, however, reveals a more complex picture: real personal consumption grew by 4.3%; conversely, government spending tumbled down by 7.5%; private inventories added 0.8 percentage points to the growth rate. So even though government spending dropped, the GDP grew by 2.6% – mostly due to higher personal consumption and gain in inventories. All in all, this wasn’t a bad result and could tie up the FOMC’s bullish sentiment with respect to the progress of the U.S. economy. The upcoming non-farm payroll report could provide another indication for the progress of the U.S. labor market. Current estimates are for a gain of 231,000 jobs in January. A much higher gain in number of jobs could result in another fall in the price of GLD. (click to enlarge) Source of data taken from the U.S. Bureau of Labor Statistics and Google Finance Moreover, if the labor market keeps showing signs of recovery over the coming months, then this will bring the FOMC one step closer towards hitting the rate hike button. The debate over the next rate hike is likely to pick up in the coming months as we will get closer to the June meeting. Some still suspect the FOMC could back down from its current direction of raising rates in the coming months. But the FOMC doesn’t tend to make such a deviation from its direction unless the economic climate when it comes to inflation and labor warrants such a change. On both counts, the FOMC continues to voice little concern and to change market expectations with a sudden announcement, while has been done in the past, seems less likely considering the conditions only continue -albeit slowly – to improve. Despite the recent fall in the price of GLD, gold holdings in GLD keep picking up, and as of last week, reached over 758 tonnes of gold – this is a 6.5% gain since the end of 2014. This is also the highest level of gold hoards for the ETF since October 2014. This means, the recent fall in the price of GLD didn’t hold back investors from investing in the ETF. Another point to consider is the ongoing rise in the U.S. dollar, which coincides with the rally of gold prices. The chart below shows the relation between the U.S. dollar and gold prices during 2014-2015. Source of chart taken from FRED The relation between the U.S. dollar and GLD should be, as expected, negative; i.e. when the U.S. dollar appreciates against major currencies, the price of GLD tends to come down. This wasn’t the case, however, in recent weeks, as indicated in the chart above. Since the beginning of the year, both GLD and the U.S. dollar appreciated. But this type of positive relation was also the case back in 2008. (click to enlarge) Source of chart taken from FRED Back then, the U.S. economy, as well as other leading economies, was in a recession. This time, however, the U.S. economy is performing well while other economies show a slowdown in growth. In both times, the demand for gold picked up when the economic climate was uncertain and the global economy wasn’t doing so well. In times of uncertainty, the U.S. dollar tends to rise, U.S. treasury yields fall and gold prices rise. The main difference is that the U.S. economy, this time, is doing much better, and thus the U.S. dollar is likely to keep appreciating. Therefore, the ongoing appreciation of the U.S. dollar is likely to eventually catch up with the price of GLD and curb down its rally. For now, it seems that even if the FOMC were to raise rates in June by 0.25%, it won’t bring down the ongoing fall in the U.S. treasury yields and, consequently, the recovery of GLD. After all, the concerns over the global economy continue to offset the impact of the potential rise in the Fed’s rate on gold. In times of uncertainty, the U.S. dollar and GLD rally. But it also means that the recent rally of GLD could slow down on account of a stronger U.S. dollar. For more see: 3 Questions About Gold Disclosure: The author has no positions in any stocks mentioned, and no plans to initiate any positions within the next 72 hours. (More…) The author wrote this article themselves, and it expresses their own opinions. The author is not receiving compensation for it (other than from Seeking Alpha). The author has no business relationship with any company whose stock is mentioned in this article.