Tag Archives: author

Lumber Is The Canary In The Homebuilders’ Coal Mine

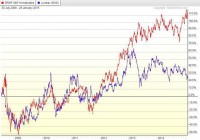
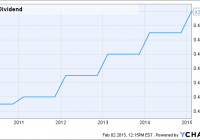
Summary Lumber prices have historically tracked quite well with homebuilder stocks. Homebuilders have also recently surged past the S&P in recent months. With the deceleration in price gains still going on and Fed support quickly evaporating, there is nothing left to prop up this industry. While I have been generally skeptical of the supposed recovery in homebuilder stocks, I have limited my analysis to trends in home prices and the ability of the American consumer to handle a mortgage at current prices. For me, this analysis is sufficient to show that homebuilder stocks are in a pretty large bubble. In the following article, though, I plan to show the value of homebuilder stocks relative to lumber prices, which themselves are a good economic indicator, but also tend to follow the valuation of homebuilder stock. The Tight Relationship of Lumber and Homebuilders (click to enlarge) In the preceding chart, I have plotted the SPDR S&P Homebuilders ETF (NYSEARCA: XHB ) and spot lumber prices. A clear correlation emerges from before 2009 to around 2013. What we also see is that around 2013, while lumber prices crashed, homebuilder stocks continued onward, and more recently have even seen some gains. Generally lumber prices are thought to track the economy quite well. While many economic analysts have been bullish on the future of the US economy, commodity and bond markets have been showing for more than a year now signs of languish. A plot of corporate bond prices would show much the same thing as lumber prices in this graph, as they also have stalled starting around the beginning of 2014. More interestingly, other commodities have started to follow along in this weakening trend, with oil recently showing a spectacular fall and copper following along. Commodity markets are showing signs of warning about the future of the economy. Lumber especially has shown a historical tight relationship with the value of homebuilder stocks, and given what has happened over the past two years, we ought to be worried about the future prospects for share prices. The next plot that I have shown is the past 6 months of the relationship between lumber and XHB. (click to enlarge) What we see from this chart of the relative valuation of XHB to lumber prices is that they have traded in a relatively tight range. Starting in 2015, however, we notice a sharp spike upwards that was quickly corrected. Over the past few days this relative valuation has shot up again. Given the last swift correction in this ratio, we can probably expect homebuilders to go down in the near-term. The homebuilder rally seems to be losing steam, as the market reacted violently to this push above historical highs. Future Prospects for Timber (click to enlarge) In order to predict future movements in the price of wood, shown above is a graph of the iShares S&P Global Timber & Forestry Index Fund (NASDAQ: WOOD ). Chaikin Money Flow analysis shows strong price growth ending around the middle of September, interrupted by a strong selloff in October, corresponding quite nicely with the overall stock market. Interesting is that since then there was a brief rise in money flow, but even while this has slowed noticeably, the price appreciation has still continued. This seems like price gain without much support, and so even timber prices themselves may be unsustainable in the medium term. What is more worrying for timber prices is the state of the overall economy. Consistently low oil will likely result in slowed economic activity as oil exploration companies drastically reduce capex spending. With decreased capital spending, we can assume downward pressure on GDP growth, which is an ominous sign for timber, as well as for housing. Technical Analysis of XHB (click to enlarge) Technical analysis of XHB itself shows signs of weakness. At the end of November XHB reached a value of about 33.50, at which point momentum was lost and the stock began to fall. While XHB has been higher since then, it also has not been able to make any real progress. Volatility in XHB has drastically increased since that time, and perhaps a greater source of worry is the Chaikin Money Flow, which turned definitely negative throughout December and has not been solidly positive since then. The market seems to find the current valuation as high enough. Summary and Action to Take XHB has seen to lost momentum, as it has not been able to have a solid increase in value since the end of November. In addition, the trend of homebuilders with XHB is approaching historic highs, and this has been met with swift correction in XHB. The long term trend shows definite signs of worry, as lumber has not agreed with the high current valuation of XHB. Now would be a great time to sell any shares of XHB, as the stock is not likely to go any higher from here on. For a more speculative investment, shorting XHB would likely be a good idea. A long time horizon is probably needed for that trade to play out, though, as XHB has been able to keep this high relative valuation for more than a year now, and only time will tell how long it will be able to keep this up. In addition, if you want to play on the underlying weakness of the US economy, shorting the WOOD ETF may be the way to go. If GDP is unable to sustain itself, then timber prices will go down along with it. This is a very speculative move, however, since timber itself does not show signs of being overbought like the homebuilders. Still, timber is going to hurt if the economy slows. I still take shorting homebuilders as the safer option since not only will they fall if the economy stumbles, but they are also presently overvalued and due for a correction even if GDP does not change much. Disclosure: The author is short XHB. (More…) The author wrote this article themselves, and it expresses their own opinions. The author is not receiving compensation for it (other than from Seeking Alpha). The author has no business relationship with any company whose stock is mentioned in this article.

Tiger Woods And Investment Gurus Lose Their ‘Touch’, Question: Do They Ever Get It Back?

Summary What do golf and investing have in common? The great performers have their ups and downs. These ups and downs of golfer Woods are compared with those of two investment gurus. Elliott R. Morss ©All Rights Reserved February 2015 Introduction Watching Tiger Woods get an 82, the worst score of his career at the Waste Management Phoenix Open on January 30th, I was reminded of other “greats” who have lost their touch. In particular, I thought of some of the great investors, like Graham, Lynch, Zweig, Greenblatt, O’Shaughnessy, and Buffet. 1 The investment performance of these gurus was truly remarkable, but like Tiger, they also have had their ups and downs. In what follows, I look at their records, Tiger’s records, along with what John Reese of Validea has been able to do using a computer model simulation of certain investment gurus’ strategies to pick stocks. Tiger Woods Woods has won 83 professional tournaments. He holds the record for most consecutive weeks at No. 1 (281), and the most total number of weeks (683). Since 1997, he has spent over twelve years atop the Official World Golf Ranking, and has been the number one player for all 52 weeks a record eight times. Few would argue that in his prime, Tiger was the most dominating and best player that ever lived. But since 2009, due to a series of physical ailments and personal problems, he has won only 10 tournaments and none of the Majors. Table 1 gives Tiger’s professional tournament wins by years. Table 1. – Tiger’s Wins Tiger is now 39 years old. Jack Nicklaus has won 3 more majors with his last win at 46. The usual question is whether Woods will be able to catch up to Nicklaus. It is striking how Tiger’s performance has fallen off… Peter Lynch I am a true believer in the random walk theory of stock prices , i.e., most information about individual stocks is reflected in their prices almost immediately. That suggests that unless you have information others do not have, picking stocks is a pretty random business. And this makes what Peter Lynch did at the helm of Fidelity’s Magellan Fund (MUTF: FMAGX ) even more impressive. As Table 2 indicates, Lynch did much better than the S&P 500 (^GSPC) in all but 2 years. Table 2. – Magellan Fund Performance The “Spread” (difference between (^GSPC) and the S&P 500 is indeed impressive. It means that on average if the S&P 500 gained 5%, Magellan gained 22.5%! And note that even in the two years the S&P 500 outperformed Lynch, the spread was very small. John Reese – The “5 Gurus” Reese has a degree in computer science from the Massachusetts Institute of Technology. He became intrigued with investment gurus and developed a computer program to simulate the stock picks of selected gurus. And since 2003, he has recorded the picks of the ” Top Five Gurus ” in a 10-stock portfolio that contains the top 2 ranked stocks from each of these guru investors. The top 5 gurus are selected based on their historical risk-adjusted performance. While the 5 guru’s performance (Table 3) is not as impressive as Lynch’s, it is nevertheless quite amazing. It means that on average if the S&P gained 5%, the 5 Guru Portfolio gained 17.9%! Table 3. – Performance of Reese’s “Top Five Gurus” Comparing Woods with the Investors Is there any reason to expect a comparison of Woods playing golf and gurus picking stocks as meaningful? I think so. Both activities are intensely mental. And in both activities, there is a danger of overthinking and becoming more “technical”. Because the length and time of the three differ, Table 4 breaks them down by period quartiles (earliest years to most recent years). And one commonality is quite apparent – the performance of all declined from their earliest years. And while it is true that getting older leads to reductions in physical performance, Woods is not old enough to justify such a decline. Table 4. – Comparing Investors with Golfer Woods On overthinking and getting more technical, Reese’s system should not be affected since his stocks are picked by a computer model. And in comparison to Lynch, the decline in Reese’s 5 Guru Model is not as significant as Lynch’s. The Future Of course, the Lynch career is over. But how about Woods and Reese? Woods is showing all the signs of overthinking and trying to get his “touch” back in technical fixes. Reese? Hard to say. So far in 2015, his “5 Guru” portfolio is down 2.7%, while the S&P is down 2.0%. Reese has just launched an ETF – the Validea Market Legends ETF (NASDAQ: VALX ). It gives investors an opportunity to invest in accordance to Reese’s modeling of gurus. While the “5 Guru” model takes the leading 2 stocks from the leading gurus, VALX takes 10 of these guru strategies and combines them together in a 100-stock portfolio. So far this year, VALX is down 2.2%. Because of Reese’s past performance, VALX and the “5 Gurus” bear watching… 1 For more on these investment gurus, see John Reese and Jack Forehand’s book, The Guru Investor: How to Beat the Market Using History’s Best Investment Strategies . Disclosure: The author has no positions in any stocks mentioned, and no plans to initiate any positions within the next 72 hours. (More…) The author wrote this article themselves, and it expresses their own opinions. The author is not receiving compensation for it. The author has no business relationship with any company whose stock is mentioned in this article.

ALLETE, Inc: Consistent Dividends Since 1950

The company has paid dividends consecutively since 1950. The shares currently sport a yield of about 3.57%. Growth of the company points directly to further growth of the dividend. As I continue my never-ending quest to find quality companies with safe, and attractive dividends, my search led me to ALLETE, Inc (NYSE: ALE ). The diversified utility company mainly focuses on electric generation in Minnesota, North Dakota, and Wisconsin. Founded in 1906, the company has a rich history, but I am more interested in its dividend history. In late January it raised its dividend 3.1% to 50.5 cents a quarter. With the raise the company now sports a 3.57% yield that is very attractive in my eyes. This was the fourth straight year of a raise, according to Dividends.com. This doesn’t seem like that much, but what I view as being just as important is consistency. Even so I believe going forward the company will continue this track of dividend growth and that is one of the main reasons I’m a fan. ALE Dividend data by YCharts The company has paid a consecutive dividend since 1950, and this is most definitely not going to change anytime soon. Some don’t like to reference the past to point to the future, however, I always believe a strong dividend history is a plus. It shows the company is dedicated to maintaining its dividend even when the market may be bad overall. On a different note, growth is setting up nicely for the company and the chart below illustrates this beautifully. year Revenue Earnings Per Share 2013 $1.02B $2.63 2014(Est) $1.09B $2.93 2015(Est) $1.15B $3.21 (Source: Yahoo Finance ) The company is expected to release its Q4 2014 results along with its FY 2014 results on February 17th before market open. Revenue, as seen above, is estimated to be reported up 7.4% compared with last year. EPS is expected to be up 11.4% compared with last year, and that trend looks to continue with EPS forecasted to be up another 9.55% for FY 2015. I have heard a lot lately about utilities being overpriced, and for some names I am in agreement. Currently the shares are trading at 19.33 times earnings, which is lower than the industry average at 21.8. The forward price to earnings is 17.9, and this is why I believe the shares are not currently overpriced. The company currently has a payout ratio of about 65%, which is a very safe number for a business in a quite stable and consistent industry. EPS of $3.21 for 2015 point to a payout ratio of just 62.8%. This then points to the company being in a great position to raise the dividend again in the next year. Beyond that, things also look good for more raises with earnings increasing nicely into 2016. A mid-term growth catalyst for the company is its recent acquisition of U.S. Water Services. This further diversifies its holdings and will provide an extra boost to growth. U.S. Water generated $120 million in revenue in 2014 and the company projects it to grow revenue 10%-15% on an annual basis going forward. This is a great investment for the company and should definitely begin to pay off during the next few years. I love this diversification because as a diversified utility, it offers good exposure for one’s portfolio. In conclusion, ALLETE is yet another strong dividend payer in the utilities sector. Although the company’s core business is electricity generation, it does have a fairly diversified portfolio of holdings, adding to it most recently with the purchase of U.S. Water. The growth trend looks to be strong, and the company has lots of room to continue to raise its dividend in the future. I believe as a long-term play, ALLETE will continue to reward its shareholders both through growth in the business and the dividend. Disclosure: The author has no positions in any stocks mentioned, and no plans to initiate any positions within the next 72 hours. (More…) The author wrote this article themselves, and it expresses their own opinions. The author is not receiving compensation for it (other than from Seeking Alpha). The author has no business relationship with any company whose stock is mentioned in this article. Additional disclosure: Always do your own research before investing.