Tag Archives: author

How To Hunt For Deep Value Stocks With Bravery Over Patience

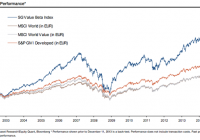
Everyone loves a bargain but choosing a strategy for finding mispriced shares isn’t as simple as it seems. Eighty years after Ben Graham and David Dodd laid the groundwork for what’s known as value investing , some of the brightest minds in finance are still working on the best ways of capturing deep value. Given that research has long shown that cheap beats expensive over the long run, honing a value strategy is clearly worth exploring. So where do you start? When Graham and Dodd wrote Security Analysis in 1934, they changed the rules on how investors should think about stocks. Chastened by catastrophic stock market losses a few years earlier, they urged investors to stop chasing expensive “glamor” and obsessing about earnings growth. Instead, they showed that it was mispriced and undervalued stocks that offered the best chance of outperformance. Ever since, investors have deployed an armory of metrics to help them find shares that don’t reflect the expected value of the companies behind them. Usually, they compare a company’s share price against what it earns — such as the price to earnings ratio — or against what it owns — such as the price to book ratio . One value ratio is never enough When it comes to these value ratios, investors often stick to their favourites. Just take a look at the the guru strategies we track at Stockopedia — many of them use just one valuation metric. But others think it’s too simplistic to use a single ratio to find and compare value stocks. In 2014 the equity research team at investment bank Societe Generale tackled this head on. Led by quant strategist Andrew Lapthorne, they’d already been tracking one value strategy called Quality Income . As the name suggests, it looks for good quality, dividend paying companies. But the focus on relatively high dividend yield is also a signpost to shares that might be cheaply priced. Quality Income was devised for what SocGen call “patient” value investors. These are the ones who are happy to let dividends compound over time in return for less volatility than you see in other types of value strategies. But Quality Income doesn’t get its hands dirty with another major source of value in the market. This is the one that most of us think of when it comes to deep value — buying beaten up, distressed, unloved and ignored stocks. Some of these laggards will never recover but others will bounce back and then some. So SocGen created an alternative strategy for the “brave” investor. Rather than rely on one single ratio, it combines five well known value factors to find stocks that are cheap relative to their sectors. Bravery is needed because these could well be companies with problems. And that means there can be sharp initial losses before the value in them eventually “outs.” The factors include: Book to Price Earnings to Price One Year forward Earnings to Price EBITDA to Enterprise Value Free Cash Flow to Price In 2014, its SG Value Beta index of the 200 cheapest companies globally returned 18.7%, which was broadly in line with other value-based indices. Since 2002, based mainly on back testing, it has consistently outperformed those benchmarks. (click to enlarge) Screening for “brave” deep value stocks Of course on reading the research it became very clear to us that the SocGen team had chosen a strikingly similar set of value ratios to Stockopedia.com’s own ValueRank — with which we already score over 18,000 European and US Stocks. Out in the cold… It’s pretty clear which sectors are currently out in the cold. Oil & gas producers like Ophir Energy ( OTC:OPHRY ) and oilfield services businesses like Petrofac ( OTCPK:POFCY ) and Hunting ( OTCPK:HNTIY ) have been beaten down of late. Likewise, there is a handful of industrials like Serco ( OTCPK:SECCY ), which slumped after issuing a series of profit warnings last year. Troubled cyclicals like pub groups Punch Taverns ( OTCPK:PCTVD ) and Enterprise Inns ( OTCPK:ETINY ) make the list, as does retailer Debenhams ( OTCPK:DBHSY ). Interestingly Debenhams had a ValueRank of 94 back in October 2014, but a gradual edging up in price has trimmed that back to 90. Financial stocks also feature heavily, with Standard Chartered ( OTCPK:SCBFF ) easily the largest by market cap. TSB Banking ( OTCPK:TSBBY ) is also there, as are insurance groups Friends Life ( OTC:RSLLF ) and Phoenix ( OTC:IPHXF ). Name Mkt Cap £m Value Rank Sector Standard Chartered 22,625 93 Financials Petrofac 2,627 91 Energy Phoenix 1,884 97 Financials Indivior 1,276 95 Healthcare Vedanta Resources 1,212 94 Basic Materials Serco 942.5 90 Industrials Debenhams 933.4 90 Consumer Cyclicals MHP SA 637.5 96 Consumer Defensives Deep Value is not for the faint hearted… It’s important to remember that digging around among the cheapest stocks in the market isn’t for the faint hearted. Often these companies come with uncertainty surrounding their financial strength or business viability. It was for that reason that Graham and Dodd encouraged wide diversification — a portfolio approach should harvest the deep value premium and absorb the inevitable losses. In the decades since they introduced the concept of buying undervalued stocks, numerous financial ratios have been used as a measure of what’s cheap. But rather than relying on a single measure, a value composite using several of those value factors is proving to be an effective way of navigating one of the trickiest parts of the market. Editor’s Note: This article discusses one or more securities that do not trade on a major exchange. Please be aware of the risks associated with these stocks.

4 Ways Alternatives Can Prepare Portfolios For The Future

Summary Many advisors and their clients are now in the process of reviewing last year’s performance and discussing how to best position their portfolios for what’s to come. I believe they should examine how alternative investments could be included in portfolios to potentially help achieve specific investment objectives. This piece lists four ways investors can use alternatives in seeking to meet common objectives. By Walter Davis Many advisors and their clients are now in the process of reviewing last year’s performance and discussing how to best position their portfolios for what’s to come. These reviews are taking place against the backdrop of a multi-year bull market in equities, low interest rates, low levels of market volatility, a strengthening dollar and declining oil prices. As advisors and clients look to navigate this landscape, I believe they should examine how alternative investments could be included in portfolios to potentially help achieve specific investment objectives. To help with this task, I have listed four ways investors can use alternatives in seeking to meet common objectives. Objective: Continue to participate in equity market upside, but with some downside protection. Investors have enjoyed a strong run in equities over the past six years, and most analysts I have read predict 2015 to be another positive year. That said, investors have also seen increased risks come into the market, such as Greece’s future in the eurozone. For investors looking to participate in a rising equity market, while also seeking to limit the downside if the market declines, equity long/short funds may be able to help. Equity long/short funds combine both long and short equity positions in a portfolio, while typically being net long to equities. In these types of funds, the long positions would be expected to capture gains in a rising equity market environment while the short positions would be expected to profit in a falling market environment. Because these funds are frequently net long, the direction of fund performance often tracks that of the overall market. Objective: Participate in market opportunities outside of stocks and bonds, such as in the commodity and currency markets. In 2014, the U.S. dollar appreciated over 10% against its counterparts, and the price of oil fell by almost 50%. Global macro funds invest across the global markets in equities, fixed income, currencies and commodities on a long and short basis. Such funds could have had the opportunity to profit from the rally in the U.S. dollar through long U.S. dollar positions, as well as from the decline in oil through short oil positions. Objective: Cushion portfolio during market swings . One theme I have seen repeatedly mentioned by market analysts is the return of market volatility to normal historic levels. Over the past six months, we have seen short periods of heightened market volatility, most recently during the first two trading weeks of 2015. For investors looking to cushion their portfolio during increased market swings, market neutral funds might be appealing options. Such funds seek to eliminate the impact of broad market movements by trading related stocks on a long and short basis, and seek to generate positive returns regardless of market environment. Objective: Generate attractive levels of income in the current low interest rate environment . With interest rates at historic lows, many investors, especially retirees, are seeking to earn an attractive level of current income off their investments. Two places that investors can explore are real estate income funds and bank loan funds. Real estate income funds invest in global real estate equity and fixed income securities and seek attractive current income. Bank loan funds seek to provide a high level of current income and capital appreciation by investing in senior loans made to corporations (usually rated below investment grade) by large banks and other financial institutions. Important Information Before investing, carefully read the prospectus and/or summary prospectus and carefully consider the investment objectives, risks, charges and expenses. For this and more complete information about the products, visit invesco.com/fundprospectus for a prospectus/summary prospectus. There is no guarantee the strategies discussed will meet their investment objectives. Investors should consider their risk tolerance and individual situation and carefully review all financial information before investing. Alternative products typically hold more non-traditional investments and employ more complex trading strategies, including hedging and leveraging through derivatives, short selling and opportunistic strategies that change with market conditions. Investors considering alternatives should be aware of their unique characteristics and additional risks from the strategies they use. Like all investments, performance will fluctuate. You can lose money. The dollar value of foreign investments will be affected by changes in the exchange rates between the dollar and the currencies in which those investments are traded. Commodities may subject an investor to greater volatility than traditional securities such as stocks and bonds and can fluctuate significantly based on weather, political, tax, and other regulatory and market developments. Investments in real estate related instruments may be affected by economic, legal, or environmental factors that affect property values, rents or occupancies of real estate. Real estate companies, including REITs or similar structures, tend to be small and mid-cap companies and their shares may be more volatile and less liquid. Most senior loans are made to corporations with below investment-grade credit ratings and are subject to significant credit, valuation and liquidity risk. The value of the collateral securing a loan may not be sufficient to cover the amount owed, may be found invalid or may be used to pay other outstanding obligations of the borrower under applicable law. There is also the risk that the collateral may be difficult to liquidate, or that a majority of the collateral may be illiquid. Short sales may cause an investor to repurchase a security at a higher price, causing a loss. As there is no limit on how much the price of the security can increase, exposure to potential loss is unlimited. The information provided is for educational purposes only and does not constitute a recommendation of the suitability of any investment strategy for a particular investor. Invesco does not provide tax advice. The tax information contained herein is general and is not exhaustive by nature. Federal and state tax laws are complex and constantly changing. Investors should always consult their own legal or tax professional for information concerning their individual situation. The opinions expressed are those of the authors, are based on current market conditions and are subject to change without notice. These opinions may differ from those of other Invesco investment professionals. NOT FDIC INSURED MAY LOSE VALUE NO BANK GUARANTEE All data provided by Invesco unless otherwise noted. Invesco Distributors, Inc. is the U.S. distributor for Invesco Ltd.’s retail products and collective trust funds. Invesco Advisers, Inc. and other affiliated investment advisers mentioned provide investment advisory services and do not sell securities. Invesco Unit Investment Trusts are distributed by the sponsor, Invesco Capital Markets, Inc., and broker-dealers including Invesco Distributors, Inc. PowerShares® is a registered trademark of Invesco PowerShares Capital Management LLC (Invesco PowerShares). Each entity is an indirect, wholly owned subsidiary of Invesco Ltd. ©2014 Invesco Ltd. All rights reserved. blog.invesco.us.com

Star Gas Partners: A Deeply Undervalued Beneficiary Of Low Oil Prices Offering 40% To 90% Upside

Summary Star Gas Partners is the largest distributor of home heating oil in the United States, serving residential and commercial customers in fourteen states throughout the Northeastern U.S. and Mid‐Atlantic. At the current valuation the Company is selling at an 18% cash flow yield based on our expectations for $68 million in distributable cash flow in 2015. When valuing SGU at close to a 30% discount to its peer EV/ EBITDA multiples the stock is worth over 90% more than the current share price. Star Gas Partners (NYSE: SGU ) is the largest distributor of home heating oil in the United States, serving residential and commercial customers in fourteen states throughout the Northeastern U.S. and Mid‐Atlantic. The Company has a market value of just $375 million, yet in 2014 generated $1.96 billion in revenues and $103 million in EBITDA. SGU’s revenues are highly recurring, with 97% of customers on automatic delivery schedules. The market for home heating oil is mature but extremely fragmented; Although, SGU has a market share that is likely under 5% it is still 200x larger than its average competitor. The heating oil industry also features attractive financial characteristics, with recurring cash flows and contractually determined gross profit per gallon. Star Gas’s gross profit is largely fixed at $1.00/gallon and the Company constantly hedges its exposure. Considering Star Gas has net debt of approx. $75 million (net debt is adjusted after making changes to working capital to reflect receivable collections) the market is drastically undervaluing the Company. At the current share price of $6.55 the Company is selling at an 18% cash flow yield based on our expectations for $68 million in distributable cash flow in 2015. Essentially, if one were to buy the Company outright at the current price they would net an 18% annual cash return before Capex (Capex is running at approx. $10 million per year). The question one might ask is how can such a high return investment be available in the current low return environment we are in? The answer lies in the following non-fundamental issues that have caused investors to bypass making an investment In SGU: SGU has an inefficient corporate structure- Star Gas was formed as an MLP, yet should ideally be structured as a corporation. Star Gas acts as a partnership, which owns Petro Holdings, which acts as the heating oil corporation. Although Petro Holdings is taxed at the corporate level, any cash moved out of the holdings and into the partnership for either dividends or share repurchases may also be taxable to unit holders as dividends. Therefore, shareholders may be obligated to pay a dividend tax without ever receiving a dividend if funds were used to repurchase shares. Although, the current structure is by no means efficient it is not material enough to justify the current discount of the Company’s shares. Low dividend yield- Although Star Gas generates over $60 million in distributable cash flow it pays out less than $20 million in dividends, which implies a 5% yield. MLP peers typically payout over 80% of their cash flow and at higher yields. Highly seasonal business leads earnings to appear volatile- Because Star Gas makes money in the winter season the Company generates all of its earnings during half the year and loses money during the other half. This presents an appearance of inconsistent earnings from quarter to quarter. Declining business due to competition- The main competition for heating oil distributors is customer conversion to natural gas, which is generally significantly cheaper than heating oil. However, for many heating oil users, the local utility has no gas main capable of reaching their homes. For others, however, once their oil burner requires replacement (estimated cost: $2,000‐$3,000) the economics can be compelling. Conversion costs average $10,000, so the incremental costs of converting can be $7,000 to $8,000. Yet, over the past five years, the loss to natural gas conversion has ranged from 1.5%‐2.0% and the Company’s overall net attrition stood at just 0.9% in 2014. All the above issues have existed now for some time, yet Star Gas continues to increase both profits and shareholder value. Since 2010 the Company has increased annual EBITDA by 44% and reduced shares outstanding by 23% from 75 million shares to 57.2 million shares. Thus, on a per share basis the Company has increased EBITDA from $1.02 to $1.79 or by 75% over the last 4 years. The market also fails to realize that Star Gas is a beneficiary of low oil prices. As heating oil prices have gone down Star Gas’s business has received a major tailwind. The company is now able to buy the same quantity of heating oil while using significantly less working capital therefore minimizing borrowing costs and working capital needs. Furthermore, as a result of lower heating bills the Company’s customers are now less likely to switch to natural gas as conversion economics have come down substantially. This tailwind was evident in their most recent Q1 2015 earnings as the company increased EBITDA by 25% to $45 million. Assuming YOY growth remains flat for the remainder of the year, Star Gas should be able to generate $70 million in cash flow and $60 million in Free Cash Flow for 2015. This should allow the company to either significantly increase its dividend or buyback program. To put things in perspective, Star Gas has a distribution coverage ratio of over 3x their current dividend. If their distribution coverage was similar to that of their MLP peers (1.1x to 1.2x) the company would have a current dividend yield of well over 10%. When we compare Star Gas to larger propane and fuel delivery MLPs the investment looks even more compelling. Company Mkt Cap (In millions) P/E Ratio EV/EBITDA P/CF Dvd Yld Average $ 3,163 20.3x 11.17x 9.87x 7.68% SUBURBAN PROPANE PARTNERS LP (NYSE: SPH ) $ 2,721 20.3x 11.1x 9.6x 7.8% FERRELLGAS PARTNERS-LP (NYSE: FGP ) $ 1,937 23.2x 11.8x 10.2x 8.6% AMERIGAS PARTNERS-LP (NYSE: APU ) $ 4,831 17.4x 10.7x 9.8x 6.7% STAR GAS PARTNERS L.P. $375 11.5x 4.8x 6.3x 5.35% As the larger comps clearly have more diversified stable businesses we do not believe Star Gas should trade at a similar multiple. However, we firmly believe the company should trade at a multiple between 6x to 8x EBITDA. Using that range, Star Gas shares would be worth anywhere from $9.15 to $12.50 per share. This implies potential upside of 40% on the low end to over 90% on the high end. Disclosure: The author is long SGU. (More…) The author wrote this article themselves, and it expresses their own opinions. The author is not receiving compensation for it (other than from Seeking Alpha). The author has no business relationship with any company whose stock is mentioned in this article.