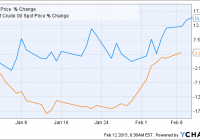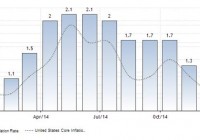
There are 2 main forces affecting gold price, Europe and FOMC. The drama in Europe has deflected the media attention which the FOMC deserves. Atlantic Fed President and FOMC Voter Lockhart deflected weak inflation arguments against liftoff in mid-2015. Lockhart argued that confidence in the progress towards maximum employment and stable prices is sufficient for policy tightening given the lag in monetary policy. Lockhart’s compelling argument forced GLD to drop 1.78% and reinforced the bearish trend on GLD. FOMC Neglected Amid Excessive European Drama Coverage In today’s context, there are 2 primary forces that are actively influencing the price of gold which we should always keep in mind when we evaluate our gold investment. On one hand, we have the headlines news about Europe and Greece on CNBC, CNN and all the major news outlet. These news station give us an overexposure to the latest flip-flops in the sovereign debt negotiations simply because it is good non-fiction drama that will keep their viewership high. In what comes as news, we have Greece taking on a seemingly compromising stance to offer a ‘menu of debt swap’. Germany rejected it and asked the Greek government to forgo its campaign promise of ending its austerity measures by repudiating its official debt and increase social spending. Greece then refuted that and take a hard stance in its debt negotiations which eventually lead the European Central Bank to cut off Greece of its cheapest debt financing using its sovereign bond as collateral. The Greek response was to demand for $11 billion euros of repatriation for World War II which Germany swiftly rejected. Greece responded with its latest initiative by involving OECD to provide credible 3rd party alternative to its reform imperative over that proposed by its official creditors, collectively known as Troika. In the background during this period of rapid change is the uncertainty of Greece membership within the European Union and the spillover effects in terms of geopolitical security such as the possibility of Greece leaving NATO to back Russia in the Ukraine conflict. Given the extensive media coverage on Europe, it is easy to forget the other side of the picture. In my earlier article, Hold GLD In The Tug Of War Over Financial Stability In 2015 , I have argued that it is the primary issue of financial stability that is driving the price of gold for now. As much as we care about the European drama, we have to keep in mind the powerful Federal Open Market Committee (FOMC) which is not receiving its fair share of attention from market participants due to inadequate media coverage. The FOMC is a dominant force of financial stability with its clear intention of policy normalization which will provide meaningful risk-free interest rates for conservative investors such as insurance companies and pension funds. These conservative investors hold significant amount of retirement funds which may not be willing to chase the riskier equity market and should not be there in the first place. Their absence will provide the forming of financial bubbles. Lockhart Neutralized Weak Inflation and Wage Growth Constraint Let us pay some due attention the Atlanta Fed President Dennis Lockhart who is a voting member of the FOMC this year. Lockhart gave his speech titled, Considerations on the Path to Policy Normalization at the Southwest Florida Business Leaders Luncheon on 06 February 2015. In my opinion, his speech is very supportive of the mid 2015 liftoff in the Federal Funds rates and this is putting pressure of gold as much as it is supportive of the strength of the USD. Lockhart gave a balanced assessment of the economy and discussed the possible constraint on the liftoff alongside with the factors supporting it. He came to the conclusion that based on current data, he is confident that the economy would have recovered to the point where it is conducive for a liftoff in mid 2015. I think the economic recovery of the United States is well established in the market right now and so before we go into the reasons supporting the liftoff, we shall look at how Lockhart address the issue of inflation. The obvious problem with inflation is that it is below 1% and far from the 2% inflation target no matter which measure of inflation you look at. For example, if you were to look at the latest Consumer Price Index (CPI) shows that prices increased by 0.8% in December 2014 when compared to December 2013. Annual core CPI might look better at 1.6% in December 2014 but it is part of a falling trend of 1.8% and 1.7% in October and November 2014 respectively. If we were to refer to the core Personal Consumption Expenditure (PCE) on a monthly basis, we will observe 2 conservative months of 0% growth for November and December 2014. (click to enlarge) Source: Tradingeconomics The chart above which compares U.S.inflation and core inflation rate according to CPI and this should anchor the point that inflation is still a distance from the 2% inflation target in the U.S. The other potential deterrent for a mid year liftoff is the low wage recovery. Given the tight labor market and the pace of jobs recovery, wages should be raising at 2%-4% based on the experience of previous recovery instead of the 0.5% increase as reported by the Department of Labor recently for January 2015. We have to keep in mind that the strong economy added 257,000 jobs in January 2015 after 329,000 jobs were added in December 2014. This has encouraged 155,000 discouraged workers to apply for jobs and re-enter to labor market. The expanded labor pool increased the unemployment rate from 5.6% to 5.7% resulting in a 0.2% increase in labor force participation of 62.9%. This quote from Lockhart sums up the challenges of weak inflation and wages increment that is facing the United States today. Just as current readings of inflation give some pause, broad wage trends seem to suggest we are not yet on the cusp of full employment. The quite modest growth of wages across the economy does not seem normal given the solid growth numbers we’ve seen in recent quarters. The Lockhart Defense Given all these headwinds against mid year liftoff, we shall look at how Lockhart defends his support for it in the next section of this article. Lockhart has 3 main points to decide his support which is scattered throughout his speech for the sake of a logical flow of ideas. I shall summarize it here as confidence in the projected economic recovery, improving market inflation compensation data and finally the requirement to ignore transient low energy prices given the lag in monetary policy. These 3 main points are actually linked towards the final destination of a mid 2015 rate hike. Lockhart expressed confidence in the sustained recovery of the economy. He foresaw growth of 3% for 2015 and 2016. This is supported by the strong economic data published recently. In addition, he has confidence that the dual mandate of maximum employment and stable prices would be achieved within 1-2 years. Lockhart shares the same view as the FOMC majority that inflation is transitory and would pass. The previous FOMC has mentioned before that market based inflation compensation remains weak while survey based inflation expectations remains well anchored. In his speech, Lockhart mentioned that market based inflation compensation has recovered and this gives him renewed confidence that inflation will catch up. This is Lockhart in his own words: Since mid-January, some inflation-compensation measures have shown signs of reversing. A firming in the inflation compensation data from their year-end lows is an example of the kind of encouraging development that will bolster my confidence in the medium-term outlook. If we look at the inflation data above, it started to show signs of weakening with July 2014 reading of 2.0% down from 2.1% in May and June. This coincides with the decline in oil prices which the FOMC attribute to the disinflation influence. Lockhart is a more dovish as he focus on the weak inflation numbers instead of the strong employment numbers indicating less capacity slack. Inflation is appropriately a focal point because its firming will reduce concerns that the economy is somehow stalling, that prophesies of long-term stagnation have any basis, and that chances of accomplishing the FOMC’s policy goals are receding. Lastly it is noteworthy that for this policy dove, there is no need for the 2% inflation target to materialize before he would move policy forward. Lockhart stressed in his speech that there is no such thing as 100% confidence and he would accept sufficient confidence. He would require the confidence that economy would move towards the Fed’s dual mandate would suffice due to the time lag between monetary policy implementation and the effects being seen on the economy. The distance between current conditions and our goals doesn’t have to be completely closed for the FOMC to start moving interest rates higher. Monetary policy is, of necessity, forward looking. If, as we look forward, it seems likely we will achieve our policy objectives, then we can consider beginning to adjust policy. Lockhart Impact on the SPDR Gold Trust ETF ( GLD) Lockhart has effectively swept away the reminding credible objection to the Fed’s interest rate hike in mid 2015. He devoted the bulk of his speech to that with a smaller part of his speech reinforcing the idea that the economy is on a strong growth trajectory to his audience. As his primary target audience are Florida businessmen, he made the point that the FOMC is expressing confidence in the economy when it raises rates and this will be self-reinforcing. From a Main Street perspective, the important point for business planning is that monetary policy is likely to shift sometime this year, and a higher interest-rate environment will ensue. The decision to begin normalization should be a signal that the FOMC is confident the economy is on track to achieve its objectives and that the economy should have sufficient strength and momentum to handle higher rates. The start of the process of normalization should itself instill confidence on Main Street. (click to enlarge) If we look at the chart daily above for GLD, we can see the extent of Lockhart’s influence on gold prices. It is noted that Lockhart speech came on the same day as the strong January 2015 labor data report so one might argue that it is the labor report which pushed down the price of gold. However we should remember that it is the FOMC members who interpret and give meaning to the labor numbers in the monetary policy decision making process. GLD opened at $119.15 on the day of his speech and closed at $117.07, marking a 1.78% decline over 4 trading days. This would be something that investors would have missed out on if they placed too much attention on Europe at the expense of the FOMC. It is clear that there is a shift in gravity from Europe back to the FOMC. The Greek drama is old news, expected and hence priced into the market. Unless there is a significant move such as a Grexit or large scale violence, further rhetoric from Europe no matter how much headlines they grab, will not move GLD up. This should be the case until the end of the month and I note that GLD is crossing in the $117 price neckline. Lockhart’s speech is persuasive and its makes a compelling case for a lift-off in mid 2015. Its serves to further reinforce the bearish sentiment in the gold market which would have otherwise rebounded on the $119 resistance level. Once again, Lockhart speech is a timely reminder of the market influence for the FOMC members. Disclosure: The author has no positions in any stocks mentioned, and no plans to initiate any positions within the next 72 hours. (More…) The author wrote this article themselves, and it expresses their own opinions. The author is not receiving compensation for it (other than from Seeking Alpha). The author has no business relationship with any company whose stock is mentioned in this article.