Tag Archives: author

Pampa Energía Is A Good Option For Normalization In Argentina

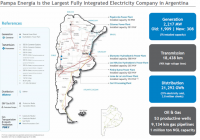
Summary Pampa Energía works in a highly distorted regulatory framework, where frozen tariffs have led to a critical situation for the utility companies. Even in this scenario Pampa Energía has managed to reach a price earning of 5 years. With a new government about to be elected, great improvements could be in the way. Pampa Energía S.A. (NYSE: PAM ) is the largest integrated electricity company in Argentina and through its subsidiaries participates in the generation, transmission and distribution of electricity, as well as natural gas transportation and production. (click to enlarge) Source: Pampa Energía. Pampa Energía owns indirectly: 84% of the generation assets. 26% of the transmission business (TRAN.BA). 52% of the distribution business with Edenor (EDN). 26% of the natural gas transportation business with Transportadora de Gas del Sur (NYSE: TGS )(pending government approval). 50% of the Oil and Gas exploration and production business with Petrolera Pampa (PETR.BA), associated with Yacimientos Petrolíferos Fiscales (YPF). As of August 17th, 2015 the market cap of the above mentioned: (click to enlarge) Source: Yahoo Finance Reminder: Transener and Petrolera Pampa stocks are only listed in the Merval Index, the market cap is expressed in Argentine Pesos -AR$-. Exchange rate as of August 17th: ARS/USD= 9.15. Updated quotes and market cap expressed in USD here . Scenario: Pampa Energía works in a highly distorted regulatory framework where frozen tariffs have led to a critical situation for the utility companies. From 2001 onwards the tariff was converted to AR$ and had practically no adjustments and no longer provides for a reasonable return on capital/assets. Full tariff reviews are pending. High inflation and regulated tariffs that took place since 2006 and 2001 respectively, have led to deep margin erosion for utility stocks. The Argentine utility stocks have underperformed their Latam and EM peers since 2001, these poor returns are explained by significant erosion in real electricity tariffs (frozen since 2001). Gross margin captured by utilities as a percentage of the GDP fall from 0.3% to 0.02%, setting the scope for a possible recovery in profits, if the upcoming political situation leads to a normalization of the current imbalances. For example, the comparison between the residential electricity cost in Argentina and regional peers shows clearly how distorted the public services tariffs are. (click to enlarge) Source: Pampa Energía. Subsidies for electricity and gas purchases cost the government around 4.5% of GDP, and the burden is growing. Some tariffs would need to triple or even be multiplied by seven times to reach market prices. With just a small correction, companies like PAM will perform better. A presidential election is coming in Argentina as of October 25, and the main contenders (Daniel Scioli, Mauricio Macri and Sergio Massa) have expressed its understanding about the need to lift some tariffs caps, in order to reduce the fiscal deficit, which is unsustainable at these levels. As the company’s aren’t capable of fulfilling the investment needs in electricity of the country, and several blackouts occur during the last quarters, the actual government is taking some measures to improve the situation. Two relevant facts take place during 2Q15 for Pampa Energía: 1) “SE Resolution No. 482/15: Increase in the Electricity Generation Remuneration Scheme On June 10, 2015, the Secretariat of Energy issued SE Resolution No. 482/15, in which it updates retroactively the remuneration for electricity generation as of February 2015 commercial transactions.” 2) “Gas Transportation Tariff Increase for Transportadora de Gas del Sur S.A. On June 8, 2015, the National Gas Regulatory Authority -ENARGAS- issued Resolution No. 3,347/15, which grants TGS a tariff increase for gas transportation and operation and maintenance fees of 44.3% and 73.1%, respectively, both retroactive to May 2015.” Source: Pampa Energía 2Q15. This and other measures have improved Pampa´s EBITDA and Profits. In the 2H15 : Consolidated sales revenues of AR$3,457.6 million ($378 million) for the six-month period ended on June 30, 2015, 18.4% higher than the AR$2,921.4 million ($319 million) for the same period of 2014. Adjusted consolidated EBITDA of AR$1,693.3 million ($185 million) for the six-month period ended on June 30, 2015, compared to AR$27.1 million ($9 million) for the same period of 2014. Consolidated profit of AR$1,365.1 million ($149 million) during the six-month period ended on June 30, 2015, of which a profit of AR$963.0 million ($105 million) is attributable to the owners of the company, compared to an AR$80.4 million loss (-$8.8 million) attributable to the owners of the company in the same period of 2014. With a market cap of $900 million, earnings per ADR in the 1H15 of $1.7, and foreseeable earnings of nearly $180 million a year, the forward P/E looks compelling. Just thinking about the replacement cost of its fixed assets, it´s easy to see how PAM is undervalued, and this is mostly caused by a regulatory environment which could improve soon. As a change in the government is approaching, it could be expected that some distortions will disappear, I´m not talking here about free market prices, as it´s “politically incorrect” to raise tariffs by 200% in a single move, but given the current situation, where PAM is trading at a forward P/E of 5, and making money under this difficult scenario, any improvement will boost earnings and improve the company´s situation. Risks: Currency risks are present since it’s widely expected that the new government will depreciate the local currency, but that depreciation will certainly include better tariffs for the utilities as the energy price is partly dollar linked as well as the importations of energy. Political risks are another factor to bear in mind, but as the current government deficit is unsustainable, some adjustments are needed. To conclude PAM is under the current conditions deeply undervalued, and that could increase if the pending integral tariff revision comes in place. If the Argentinean economy is going to improve, massive capex in the electricity sector would be needed, and PAM is in the better position to profit from that. Disclosure: I/we have no positions in any stocks mentioned, but may initiate a long position in PAM over the next 72 hours. (More…) I wrote this article myself, and it expresses my own opinions. I am not receiving compensation for it (other than from Seeking Alpha). I have no business relationship with any company whose stock is mentioned in this article.

Foreign Funds To Buy On Worst U.S. Funds Outflow Since ’93

Domestic equity-focused funds are facing a tougher time in terms of fund outflows than what they experienced during the financial crisis. According to Morningstar data, US-focused mutual funds and exchange traded funds have seen $78.8 billion worth of outflows in the first seven months of 2015. This is higher than any full-year outflows since 1993. Continued transfers from open-end mutual funds to collective investment trusts at Fidelity triggered much of the outflows. In contrast, investors have poured $179.2 billion in these seven months into funds focused on international equities. This is close to the full-year peak of $201.6 billion recorded in 2013. In response to this outflow, we will pick 3 top-ranked funds for investors interested in foreign mutual funds. Before doing so, let’s look into some other details. US versus International Markets International markets have attracted investors backed by the improving conditions. Greece debt negotiations had been a concern through most of 2015’s first half, but Europe as an investment destination had other attractions. The monetary stimulus plan, for example. China had a great bull bun before it hit a rough patch in June, though. Japan too has been profitable, and the country’s equity funds notched the best gains in first half of 2015. As of July 31, the Standard & Poor’s 500 (.INX) returned 2.2%. In contrast, MSCI EAFE Index had returned 6.5%. Morningstar notes that the consensus opined that the US is in late stages of bull market. Foreign country stocks are said to be cheaper on a fundamental level. Investors are aware of the US and Europe’s “different points in the economic cycle”, which is being revealed in the flows. The fund outflows in 2015 so far has been worse than that of the recession years. Since 2007, the US has witnessed outflows 6 times (including YTD 2015). International equity funds have witnessed outflows only once in 2008. Active versus Passive Fund Flow Inflows into passive funds failed to offset the outflows from the active US equity funds. In July alone, estimated net outflows from US equity funds in July increased to $14.3 billion from $8 billion in June. The active funds saw outflows of over $20 billion in July, while inflows of over $6 billion were recorded on the passive side. Over the last 1-year period, over $158 billion flowed out of active funds, while the passive funds added over $140 billion. Meanwhile, international equity funds saw inflows on both active and passive sides. Active and passive funds added over $3 billion and $18 billion, respectively. Category and Fund Family Performance The foreign large blend category has emerged as the best one. Inflows to this category were higher than those to the other top four categories, says Morningstar. Assets of foreign large blend funds are concentrated in Europe. Along with this, European stock also featured in the top 5 list. So, Europe did prove to be a favorable investment decision in July. As for the laggards, Large Growth , Large Value and Large Blend were the worst losers. These are almost all the representative categories of the US markets. Coming to the fund families, only 3 out of the 10 fund families under the study witnessed inflows on the active side in July. These are american funds SPDR State Street Global Advisors and J.P. Morgan. Meanwhile, Fidelity Investments witnessed the biggest outflows on the active side for both July and the last 1-year period. Again, much of Fidelity’s outflows indicated continued transfers from mutual funds to collective investment trusts. Fidelity witnessed outflows of over $10 billion in July and close to $19 billion over the last 1-year period. Fidelity Contrafund Fund No Load (MUTF: FCNTX ), Fidelity Growth Company Fund No Load (MUTF: FDGRX ) and Fidelity Low-Priced Stock Fund No Load (MUTF: FLPSX ) accounted for outflows of $2.36 billion, $2.1 billion and $1.46 billion in July. Franklin Templeton Investments was also a big loser for both periods, while Vanguard and T. Rowe Price witnessed outflows in July against inflows over the last 1-year period. If we look into 5 of the bottom-flowing active funds, 3 of them are from Fidelity. 3 Non-US Mutual Funds to Buy Morningstar notes that the fund flows indicate investors’ expectations for the future. So, investors looking to buy non-US Equity mutual funds should consider the following funds that either carry a Zacks Mutual Fund Rank #1 or Zacks Mutual Fund Rank #2. Matthews Japan Fund Investor (MUTF: MJFOX ) invests most of its assets in preferred and common stocks of firms located in Japan. The fund may invest in companies of all sizes, but the adviser expects them to be mid- to large-cap firms. MJFOX carries a Zacks Mutual Fund Rank #2. MJFOX has returned 22.9% so far this year, and its one-year return stands at 15.3%. The 3- and 5-year annualized returns are 18.1% and 14%, respectively. The fund carries an annual expense ratio of 1.03%, lower than the category average of 1.43%. MJFOX carries no sales load. Cambiar International Equity Fund Investor (MUTF: CAMIX ) invests a large chunk of its assets in equity securities of medium- to large-cap non-US companies. For greater liquidity and lesser custodial expenses, CAMIX buys American Depositary Receipt listings of foreign firms on the US exchanges instead of buying them on foreign exchanges. CAMIX carries a Zacks Mutual Fund Rank #1. It has returned 12.5% so far this year and its one-year return stands at 7.6%. The 3- and 5-year annualized returns are 12.1% and 10.3%, respectively. CAMIX carries an annual expense ratio of 1.09%, lower than the category average of 1.17%. The fund carries no sales load. Fidelity Overseas Fund No Load (MUTF: FOSFX ) seeks long-term capital growth. It invests a large portion of its assets in non-US securities. Management considers the size of the market in each country and region relative to the size of the world market as a whole. FOSFX invests primarily in common stocks. The fund offers dividends and capital gains annually in December. The Fidelity Overseas fund has returned 4.9% and 8.6% over the year-to-date and 1-year periods. The 3- and 5-year annualized returns are 16.7% and 16.3%. FOSFX, managed by Fidelity, carries an expense ratio of 1.04% as compared to a category average of 1.17%. FOSFX carries no sales load. Original Post

An ETF That Is A Dividend Growth Investor’s Best Friend

Summary As you might surmise from my chosen pseudonym, ETF Monkey, my portfolio is comprised mostly of ETFs. Awhile back, I gave serious thought to building a “mini ETF” of my own comprised of solid, dividend-paying, stocks. In the end, however, I settled on increasing my weighting in an ETF that I feel may do the job better than I could have done it myself. As probably comes as no surprise, based on my chosen pseudonym of ETF Monkey, my portfolio is comprised mainly of ETFs. In fact, as of this morning, 78.95% of my portfolio is in ETFs. Adding in my cash balance of 12.52%, that means that only 8.53% of my portfolio is in individual stocks. Which individual stocks, and why I selected them, may be the subject of a future article. As a middle-aged and fairly conservative investor, I also love dividends and the solid companies that pay them. Awhile back, I seriously considered carefully selecting perhaps 10 such stocks to add to my portfolio; stocks in companies with solid economic moats, a strong and consistent history of dividend payments, and solid prospects for the future. In other words, the sort of stock that I would be willing to buy and hold for the metaphorical “forever.” I did some work, compared various sources and research, and started to build my list. Long story short, I set it all aside. Why? Because the more I thought about and researched one ETF–ironically, one I already owned–the more I found myself in favor of simply adding weighting in that ETF. And what, pray tell, is this ETF? It is the Vanguard Dividend Appreciation ETF (NYSEARCA: VIG ). Before we dive deep into the details of this particular ETF, let me first quickly address a couple of practical considerations I pondered: Expenses – One of the things I really appreciate about Vanguard is that they offer a wide variety of ETFs–including some that are specialized–at extremely low expense ratios. In the case of VIG, it is a mere .10%. For perspective, if I were to trade my proposed 10 stocks individually, with an $8 commission I would need to trade in chunks of at least $8,000 (per stock) to generate a trading cost of .10%. “Yes, but that is only one time,” I hear some objecting, “not year after year.” This is true, but that leads me to.. Stock Selection – Selecting 10 individual stocks would mean I would first need to narrow down my choices from a large number of candidates and buy them. But it would not stop there. Moving forward, I would need to track them and make future decisions, likely involving more trades. This could range from simple re-weighting, as needed, all the way to the question of whether I had made a bad choice (or two) and really should swap it for something else. Now, before I go any further, a caveat. I will explain the choice I made. That doesn’t mean the choice is right for everyone. But, for me, I was not convinced that I would necessarily be able to do better than to pick a high-quality ETF that attempted to do the same thing. So, I decided to see if I could find one that matched the philosophy of what I wished to accomplish. Ultimately, as mentioned, I settled on VIG. “But There Are ETFs With Higher Dividend Payouts” Please allow me to anticipate one potential objection and get it out of the way right away. VIG does not have the highest current dividend ratio of many of the specialized ETFs that play in this area. In fact, Vanguard’s factsheet for VIG reveals a 30-Day SEC Yield of “only” 2.19% as of 8/17/15. For me, though, today’s yield is not the main consideration. You see, every single company in the base index from which this fund is built has a history of “at least 10 consecutive years of increasing annual regular dividend payments.” Such a track record speaks volumes about the financial management of these companies. Not only does it mean that they have a history of rewarding shareholders, but it also means that they run their businesses with a great deal of financial discipline. Think about one last thing before we leave this section. Such a history over 10 years means that these companies maintained this record through the horrible downturn from 2007-2009. In summary, I made a decision that I wanted to think with a view to the long term, and select the type of companies that would give me a great chance of reaching my goals. A Truly Unique ETF As it turns out, VIG is truly a unique ETF. I stumbled across a very interesting tidbit when I took a look at VIG’s investment strategy and policy page. (click to enlarge) That stopped me in my tracks. Is it really the case that there is an index administered exclusively for Vanguard? Turns out, there is. Here, from the methodology fact sheet for the NASDAQ U.S. Dividend Achievers Select Index , is the eligibility criteria: (click to enlarge) Note that last bullet; “additional proprietary eligibility.” To confirm this, if you look at the overview sheet for the index, you will see that only one ETF product is based on that index; VIG. Here are a couple of other points of interest about the index: A thorough evaluation of all securities in the index is performed every March. All resulting additions or deletions are effective after the close of trading on the third Friday in March. However, a security which ceases to meet the criteria for inclusion in the index may be removed at any time during the year. The portfolio is rebalanced annually such that the maximum weight of any security in the index does not exceed 4%. This takes place as of the last trading day in February. Composition With 181 securities in both the index and fund, VIG is fairly focused. It forms a nice addition to a portfolio that is anchored by a “total market” ETF, such as the Vanguard Total Stock Market ETF (NYSEARCA: VTI ). Here are a couple of extremely helpful screen shots with more details on the fund’s composition. First, from the latest fact sheet Vanguard provides to institutions . What I liked about this presentation is that it captured both the Top-10 holdings and sector breakdown right next to each other: (click to enlarge) A couple of quick observations: You may note that Microsoft has temporarily exceeded the 4% maximum weighting target. This will automatically remedied, if appropriate, at the annual rebalancing process. This index excludes REITs. I like that because it allows you to add REITs separately if desired, using an ETF such as Vanguard REIT Index ETF (NYSEARCA: VNQ ). The index notes make it clear that this decision was made because REIT dividends do not enjoy the same tax advantages as corporate dividends and, therefore, that you may not wish to include REITs in a taxable account. Here’s the second picture, from the fact sheet for the index itself. Please note the decided tilt toward large-cap securities. Performance As we sit with the U.S. market close to historical highs, and with many observers theorizing that it may be a little “frothy” at the moment, it is certainly valid to ask how VIG might perform in the event of a correction, or worse. If history is any indicator, it may do reasonably well. Here is a chart showing VIG’s performance against the S&P 500 index during the severe downturn the market experienced between 10/1/2007 and the bottom on 3/9/2009. VIG data by YCharts While the downturn was dramatic in all cases, VIG managed to outperform by some 8.5% over that period, not including dividend distributions. To be fair, though, let’s look at the other side of the coin. How have both fared since the historical bottom on March 9, 2009? Have a look at this chart. VIG data by YCharts Clearly, in rising markets, VIG tends to underperform. Of course, this analysis also excludes dividend distributions. Given where the market sits at the present time, I feel good about having something I view as at least slightly defensive in my portfolio. Summary and Conclusion As mentioned in the outset, I looked long and hard at building what I might describe as a “mini ETF” of dividend paying stocks for myself. The more I looked at VIG, however, the more I wondered if I genuinely could do better. VIG contains the kind of stocks I want as underpinnings of my portfolio. Since I will only have to trade it very intermittently, it will keep my trading costs low. And that low .10% expense ratio, to me, is a small price to pay for having a diversified base of 180 or so of these types of stocks, in industries I like, and rebalanced as necessary for me. What about you? I’d love to hear your thoughts. Happy investing! Disclosure: I am/we are long VIG, VNQ, VTI. (More…) I wrote this article myself, and it expresses my own opinions. I am not receiving compensation for it (other than from Seeking Alpha). I have no business relationship with any company whose stock is mentioned in this article. Additional disclosure: I am not a registered investment advisor or broker/dealer. Readers are advised that the material contained herein should be used solely for informational purposes, and to consult with their personal tax or financial advisors as to its applicability to their circumstances. Investing involves risk, including the loss of principal.