Tag Archives: alternative

11 Stocks Plus Cash Saw $24,000 Grow To Over $1 Million

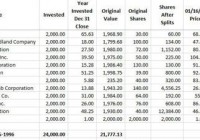
Summary Start in 1985 with a $2,000 investment in cash. Make one $2,000 investment at the end of the year from 1986 through 1996. Investments are assumed to be made in an IRA to shelter from taxes. The first $2,000 was invested in cash to pay for commissions and other fees. The average investor can save a tidy sum for retirement. It takes some luck, perseverance, and a buy and hold approach. The portfolio constructed would generate $22,400 in dividends for 2015. The portfolio was constructed by entering stock symbols into a spreadsheet in random order. The model assumed a $2,000 a year investment from 1985 through 1996 or 12 years. The first – year investment of $2,000 was invested in cash to account for commissions and other fees. The results are not actual results, but hypothetical results. Dividends that would have been earned on investments have been ignored or assumed to have been invested in stocks that blew up and went to zero ($0.00). The results generated most likely are influenced by a survivor basis. Nevertheless, the exercise proved useful. Data was obtained from company websites and or Yahoo Finance. The performance results are handicapped by not accounting for dividends paid since purchase nor assuming they are reinvested. The portfolio results presented are conservative to consider a worst case rather than an unrealistic best case. This is part one. The second part will cover the years 1998 through 2014. The model portfolio is shown below. (click to enlarge) Chart of the stock performance since inclusion into the model portfolio is shown below. Kellogg (NYSE: K ) K data by YCharts Archer Daniels Midland (NYSE: ADM ) ADM data by YCharts Starbucks (NASDAQ: SBUX ) SBUX data by YCharts The Home Depot (NYSE: HD ) HD data by YCharts Exxon Mobil (NYSE: XOM ) XOM data by YCharts Stryker (NYSE: SYK ) SYK data by YCharts Caterpillar (NYSE: CAT ) CAT data by YCharts Charles Schwab (NYSE: SCHW ) SCHW data by YCharts JPMorgan (NYSE: JPM ) JPM data by YCharts Wal-Mart (NYSE: WMT ) WMT data by YCharts Microsoft (NASDAQ: MSFT ) MSFT data by YCharts Bottom line: With a little luck and experience, it is possible for a modest investment to grow into a nice nest egg. What do you think? Disclosure: The author is long ADM, SYK, SCHW, JPM, MSFT. (More…) The author wrote this article themselves, and it expresses their own opinions. The author is not receiving compensation for it (other than from Seeking Alpha). The author has no business relationship with any company whose stock is mentioned in this article. Are you Bullish or Bearish on ? Bullish Bearish Neutral Results for ( ) Thanks for sharing your thoughts. Submit & View Results Skip to results » Share this article with a colleague

Sapa JV Achieves 9% Growth In North America For Norsk Hydro

Summary Today’s earnings from Orkla act as a partial pre-announcement for Hydro’s earnings next week, due to the 50/50 joint venture. The Norwegian government invests NOK 1.5 billion in Norsk Hydro’s new plant, with the European Trade Commission’s blessing. Hydro reports on February 10th – are there more surprises? In my most recent article about Norsk Hydro ( OTCQX:NHYDY ), I focused on some key drivers for EPS that I felt made the company a better value play than Alcoa, Inc. (NYSE: AA ). Today’s earnings announcement by Orkla ASA ( OTCPK:ORKLY ) gives us a sneak peek into Hydro’s earnings next week. Sapa is an extruded aluminum company, and is run as a 50/50 joint venture between, Orkla ASA ADR and Hydro: September 12, 2013 press release . Sapa is the global leader in extruded aluminum, and has a market share of 30% in North America and 26% in Europe. It offers a variety of solutions to its customers through five business segments, and is a leader in energy-efficient buildings. Sapa also has a strong presence in Asia and South America. “Orkla’s share of Sapa’s result was NOK -360 million in the quarter. Sapa’s results were negatively impacted by extraordinary costs related to the accounting write-down of fixed assets in China. Demand for extruded aluminium products in North America rose by 9%, primarily driven by growth in the automotive and building industry. In Europe, demand was on a par with 2013.” – Earnings release Sapa makes up only a part of Hydro’s earnings, but level demand in Europe is encouraging, as it has been recognized that the European economy may be contracting. Growth in North America appears robust at 9%, and bodes well given the current high aluminum price. It will be necessary to wait for Hydro’s results to get a full picture of the accounting write-down, but I anticipate that it will be similar to write-downs made by Alcoa this quarter, which had a negligible effect on share price. The write-down should not be taken out of context from the rest of Hydro’s earnings. The strong demand is evident, and should translate across all of Hydro’s primary aluminum business. A further NOK 1 billion in synergy savings is anticipated over the next 2 years. This fact will only enhance the value of Sapa for both of its parent companies. It is all cash that falls straight to their bottom lines at each earnings announcement. Norwegian Government Invests in Eco-Friendly Norsk Hydro Central to my thesis about Hydro is the idea that the company can continue to make more money by being as environmentally friendly as possible. In other news yesterday: “The EFTA (European Free Trade Association) Surveillance Authority has approved funding of NOK 1.5 billion from Enova for Hydro to test the world’s most energy- and climate-efficient aluminum production in a full-scale pilot plant at Karmøy, Norway.” – Hydro press release. Enova is a Norwegian state-supported agency for promoting efficient-energy consumption and renewable energy. The same day, and sticking with the eco-friendly theme, Hydro announced a new research partnership with SGL Group ( OTCPK:SGLFF ). The project will take place over the next three years, and is being funded by the Research Council of Norway. The goal is to develop new, energy-saving, carbon cathode technology for use in the primary aluminum production process. Any reduction in energy costs is a big saving for Hydro, but it also provides extra income, because Hydro sells any excess energy it produces into the national grid. Exactly how well Hydro performed over all in the fourth quarter is still somewhat of a mystery. If results from Alcoa are anything to go by, the company should surprise to the upside next week. The two press releases yesterday continue to confirm that the future looks bright for Hydro. I look forward to seeing the increased earnings created by the synergies at Sapa over the rest of the year. The stock has performed well over the last year or so since my first article about it . It would appear there is more to come. NHYDY data by YCharts Editor’s Note: This article discusses one or more securities that do not trade on a major exchange. Please be aware of the risks associated with these stocks. Disclosure: The author is long NHYDY. (More…) The author wrote this article themselves, and it expresses their own opinions. The author is not receiving compensation for it (other than from Seeking Alpha). The author has no business relationship with any company whose stock is mentioned in this article. Additional disclosure: This article is not intended as investment advice. It is for informational purposes only and expresses the authors opinion. The reader should conduct their own research and form their own opinion prior to initiating any position. Actual outcomes may vary from those discussed in the article.This article may contain certain forward-looking statements. I have tried, whenever possible, to identify these forward-looking statements using words such as “anticipates,” “believes,” “estimates,” “expects,” “plans,” “intends,” “potential” and similar expressions. These statements reflect my current beliefs and are based on information currently available. Accordingly, such forward-looking statements involve known and unknown risks, uncertainties and other factors which could cause actual results, performance or achievements to differ materially from those expressed in or implied by such statements. I undertake no obligation to update or provide advice in the event of any change, addition or alteration to the information contained in this article including such forward-looking statements.
A Return To Emerging Market ETFs

More investors are turning to the emerging markets. Emerging markets look relatively cheap compared to U.S. equities. What’s supporting the emerging market investment theme. While developed markets languished, investors turned to emerging markets and related exchange-traded funds for a cheaper play on global markets. Emerging equities are outperforming developed markets. Year-to-date, the iShares MSCI Emerging Markets ETF (NYSEARCA: EEM ) rose 1.1% and the Vanguard FTSE Emerging Markets ETF (NYSEARCA: VWO ) increased 1.6%, whereas the SPDR S&P 500 ETF (NYSEARCA: SPY ) dipped 1.8%. According to the Institute of International Finance, investors funneled $18 billion into emerging market stocks and bonds over January, reports Carolyn Cui for the Wall Street Journal . While EEM and VWO experienced heavy outflows , some areas drew heavy inflows. For instance, the iShares MSCI India ETF (BATS: INDA ) added $617.2 million in assets, iShares MSCI Taiwan ETF (NYSEARCA: EWT ) saw $172.0 million in inflows and the Market Vectors Emerging Markets Local Currency Bond ETF (NYSEARCA: EMLC ) experienced $148.4 million in inflows, according to ETF.com data. As the developed markets stumbled at the start of the new year, investors turned to other global opportunities that could generate improved returns, following the rally in developed-market equities and fixed-income assets last year. “Emerging markets are one of the few bargains out there in an increasingly expensive world,” Jeffrey Kleintop, chief global investment strategist at Charles Schwab Corp., said in the article, arguing that the low valuations could provide “some sort of buffer” when volatility spikes. For instance, EEM shows a price-to-earnings ratio of 12.1 and a price-to-book of 1.5, VWO has a 12.3 P/E and a 1.6 P/B. In contrast, SPY shows a 17.3 P/E and a 2.5 P/B. The cheap raw materials and commodities prices will help fuel emerging market growth at a faster pace than developed economies. For example, India is well positioned to benefit from cheap oil prices as the country is a prominent energy importer. Meanwhile, countries like Taiwan can benefit from the U.S. recovery as the island country is the 12th largest goods trading partner with the U.S. as of 2013 data . Moreover, the added global liquidity, with the European Central Bank adopting a €1 trillion, or $1.3 trillion, quantitative easing program , could push investors toward emerging markets to chase after higher returns. Investors who are concerned about the continued strength in the U.S. dollar and its effect on emerging market exposure can also consider the recently launched iShares Currency Hedged MSCI Emerging Markets ETF (NYSEARCA: HEEM ) and the Deutsche X-trackers MSCI Emerging Markets Hedged Equity Fund (NYSEARCA: DBEM ) , which is three years old, to track developing markets while hedging against forex risks. Max Chen contributed to this article . Tom Lydon’s clients own shares of EEM and SPY. Disclosure: The author is long EEM, SPY. (More…) The author wrote this article themselves, and it expresses their own opinions. The author is not receiving compensation for it. The author has no business relationship with any company whose stock is mentioned in this article.