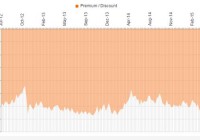
Summary Selling at a 13% discount to net asset value. ZF uses a GARP approach and has a managed distribution of 6% of NAV. Share buyback program adds alpha. The Zweig Fund (NYSE: ZF ) is an unleveraged U.S. equity closed-end fund that uses the “Growth at a Reasonable Price” or GARP approach. It invests mainly in large cap stocks that pay dividends. The Fund management adopts a top-down approach using econometric analysis of each sector, followed by a detailed review of securities at an industry group level. Fundamental analysis is then used to look for securities that offer superior total return opportunities. The fund is currently fully invested in equities, but cash allocations may be used at times based on asset allocation decisions of the fund managers. Dr. Marty Zweig, who passed away in 2013, was the fund’s creator. Marty was one of my favorite guests on the old Wall Street Week show with Lou Rukeyser. Marty always seemed nervous about market conditions on the show, but he was exceptionally disturbed on Friday, October 16, 1987 when he accurately called the stock market crash of 1987 which occurred the following Monday. Zweig created a large body of statistical market research, including the put/call ratio and other investment sentiment measures. The Zweig Fund still uses some of Marty’s research today to determine asset allocations. The current portfolio managers, Carlton Neel and David Dickerson, have managed the fund since 2003, and worked with Dr. Zweig for more than 17 years. ZF uses a 6% Distribution Policy where they pay out 6% of average net asset value every year. The Fund has a long history and was created in 1986. Over the Fund’s long history, there have been some variations in the discount or premium to NAV which has ranged from a 20% discount to a 20% premium. But over the last three years, the variation has been narrower, and the discount normally varies between -9% and -13%. (click to enlarge) Share Repurchase Program Last year, ZF extended a share repurchase program that allows the fund to repurchase up to an additional 10% of its shares outstanding. This program is intended to narrow the discount to NAV, and allows the fund to acquire its shares in the open market when they are trading at a discount. The share repurchase program is highly beneficial even when it doesn’t immediately narrow the discount, since it is accretive to NAV and adds some “alpha” to the fund’s performance. You add the annual managed distributions to the share repurchases to get the total amount of assets returned to shareholders at NAV. The fund started its buyback of shares on April 13, 2012. In 2013, they repurchased 1,403,553 shares at an average price of $13.76. In 2014, they repurchased 388,500 shares at an average price of $14.89. As of December 31, 2014, there were 1,860,041 shares remaining (representing 9.1% of the Fund’s shares then outstanding) that are authorized to be purchased under the repurchase plan in the future. (Data below is sourced from the Zweig Fund website unless otherwise stated.) Top Ten Holdings (as of March 31,2015) Macy’s Inc. (NYSE: M ) 2.16% MasterCard Inc. (NYSE: MA ) 2.14% Trinity Industries (NYSE: TRN ) 2.13% Royal Caribbean Cruises, Ltd. (NYSE: RCL ) 2.12% Abbott Labs (NYSE: ABT ) 2.10% Valero Energy (NYSE: VLO ) 2.09% Biogen Idec (NASDAQ: BIIB ) 2.04% BB&T Corp. (NYSE: BBT ) 2.03% Facebook (NASDAQ: FB ) 2.01% HCA Holdings (NYSE: HCA ) 2.01% Equity Sector Allocation % Fund Information Technology 18.02 Industrials 17.26 Healthcare 16.62 Consumer Discretionary 16.45 Financials 13.09 Energy 7.85 Materials 4.23 Consumer Staples 3.74 Telecommunication services 1.79 Ticker: ZF Zweig Fund pays quarterly Total Net Assets= 345 Million Total Common Assets= 345 Million Quarterly Distribution= $0.253 Annual Distribution= $1.012 Annual Distribution Yield= 6.87% Fund Expense ratio= 1.16% Discount to NAV= -12.80% Number of Holdings= 56 Portfolio Turnover rate= 6% Leverage= None There may be a good medium-term trading opportunity in ZF right now. Over the last year, the average discount to NAV has been -11.7%. The 1-year discount Z-score is -1.63, which means that the discount to NAV is almost two standard deviations below the average. Source: cefanalyzer ZF is only moderately liquid, and some care must be taken to acquire a large position. Yahoo Finance lists an average daily trading volume of 46,000 shares, which is equivalent to $680,000. The bid-asked spread is usually one or two cents, but there is often only limited size available. Disclosure: I am/we are long ZF. (More…) I wrote this article myself, and it expresses my own opinions. I am not receiving compensation for it (other than from Seeking Alpha). I have no business relationship with any company whose stock is mentioned in this article.