Trade Ideas To Make Money From The Strong U.S. Dollar – Idea 1
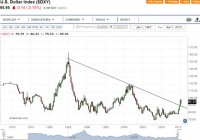
Summary A stronger U.S. Dollar will make USD denominated emerging market debt to become more expensive. As higher default risks get priced into sovereign bonds especially post the Greek debt default saga, a significant price decline could ensue. The slowing emerging market growths are not positive for emerging market debts. The U.S. Dollar has been on a tear since July 2014 and the knock-on effects of a significantly stronger U.S. Dollar have already been felt amongst the whole spectrum of commodities. With the U.S. Dollar having convincingly broken out a multi-year downward trendline (see chart below), it is quite apparent that we are only in the early stages of the USD bull market. The two main reasons which underpin my view are as follows: Divergence in monetary policy – As the U.S. intends to raise rates while the rest of the major economies are still easing, this will incentivise investors to hold more USD denominated assets. The global Carry Trade which is in the trillions of USD is likely to see a reversal as U.S. interest rates rise. This will cause the USD to get bid. Since the USD is still the world’s reserve currency and most transactions are denominated in USD, it goes without saying that this USD bull market will not only radically change the dynamics worldwide but this will undoubtedly also create exciting trading opportunities in a panoply of areas. This series will look at ideas in the following areas: Emerging Market Debt (Idea 1) Emerging Market Equity (Idea 2) – we’ll shortlist a few opportunities at the Emerging Markets Indices level and at the Individual Stocks level. The U.S. Equity Market (Idea 3) – we’ll shortlist a few opportunities at the Individual Stock level. Opportunities in the currency space (Idea 4) – we’ll shortlist a few currencies which still offer good risk/reward. (click to enlarge) The knock-on effects of the nascent USD bull market are many. Today, I’ll talk about one of the ways I intend to play the stronger USD. Before giving away my trade idea, let’s go back a few years in history. Ultra-low interest rates in the U.S. have allowed several countries mainly emerging economies to borrow cheaply in USD to invest in their local economies with the idea that local investments are going to yield much higher interest rates. Logic has it that if you borrow in USD, you need to pay back your loans in USD as well. With the USD significantly higher nowadays than when the loans were taken, the latter are undoubtedly getting more expensive to service. We can even go further and look at the slowing pace of GDP growth in emerging economies including China to deduce that the local investments are no longer yielding as high returns as they used to. TRADE IDEA Shorting emerging market government bonds denominated in USD is my way of playing out the dynamics I have outlined earlier. The iShares J.P. Morgan USD Emerging Markets Bond ETF (NYSEARCA: EMB ) provides a great way to structure this trade idea especially for retail traders and the non-professionals who might not have access to express their views on emerging market bonds. EMB is an ETF holding various Emerging Market bonds which are denominated in USD. EMB is therefore negatively-correlated to the U.S. Dollar as shown below: (click to enlarge) The top 10 holdings of EMB are as follows: Name Weight (%) Market Value Duration Notional Value RUSSIAN (FEDERATION OF) RegS 1.92 $105,401,168 4.25 105,401,167.71 ARGENTINA REPUBLIC OF 1.11 $60,941,923 7.93 60,941,923.07 PERU (REPUBLIC OF) 1.02 $56,204,117 10.64 56,204,116.84 POLAND (REPUBLIC OF) 1.02 $55,977,705 3.54 55,977,705.36 URUGUAY (ORIENTAL REPUBLIC OF) 1.02 $55,887,349 15.02 55,887,348.87 POLAND (REPUBLIC OF) 0.98 $53,632,120 5.71 53,632,120.47 PETRONAS CAPITAL LTD. RegS 0.92 $50,412,611 3.68 50,412,611.24 ROMANIA (REPUBLIC OF) MTN RegS 0.89 $48,771,815 5.34 48,771,814.69 HUNGARY (REPUBLIC OF) 0.81 $44,693,103 4.83 44,693,103.00 LITHUANIA (REPUBLIC OF) RegS 0.81 $44,657,864 5.36 44,657,863.89 The complete Holdings data of EMB is available here . I believe we are still in the early stages of the trade and we have a long way to go as the U.S. starts tightening and Emerging Markets start getting squeezed. The Fed has indicated that rates will not rise too quickly but I believe that once rates come up and people start anticipating the changes in dynamics worldwide, emerging market bond prices could accelerate downwards owing to the catalysts discussed below. The time horizon for this trade to play out would be around 1 year starting from the date the U.S. starts raising rates. From the graph above, we can see that the risks associated with the increasing U.S. Dollar have not yet been priced into EMB (see the divergence). CATALYSTS A strengthening U.S. Dollar will raise the probability of defaults. Although if none of the emerging countries defaults, when the increased risks get priced into the bonds this will likely create downward pressure on bond prices. The odds of higher default risks getting priced in are quite high post the Greek debt default saga. The slowing economic growths in multiple emerging markets could act as a tailwind to EMB’s collapse. One salient example is Russia which is the world’s largest exporter of energy. It is technically in a recession since the collapse of the oil price. In addition, inflationary pressures could provide further impetus to raise rates to stoke inflation. The effective duration of the portfolio is 7.53 years. When risk gets priced in, a long-duration portfolio is likely to face significant downward pressure. (Theoretically, for every 1% rise in yield of the portfolio, we expect the portfolio to go down in value by 7.53%). The imminent rise in the U.S. interest rates could also pose a danger to emerging market bonds as ultimately, the U.S. starts exporting its tightening monetary policy overseas. Technically, EMB looks poised for breaking the near-term resistance level around the 107.50-108 area. Once this happens, we’ll be looking at testing the 105 level and if this goes, EMB could quickly accelerate towards 100 break down further. (click to enlarge) As always, we can’t have 100% certainty when putting on a trade but as traders, our job is to put all the odds in our favor. We have an unfavorable macro environment for emerging market debt and in addition to that, slowing economic growths in emerging countries are likely to put pressure on sovereign debt financing. Furthermore, we’ve seen that the EMB portfolio has a long duration and any spikes in bind price volatility due to increased risks being priced in have the potential to accelerate the decline of the EMB. Disclosure: I am/we are short EMB. (More…) I wrote this article myself, and it expresses my own opinions. I am not receiving compensation for it (other than from Seeking Alpha). I have no business relationship with any company whose stock is mentioned in this article.