Scalper1 News
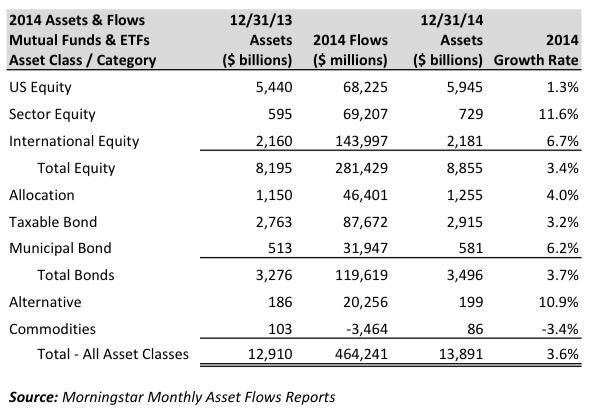
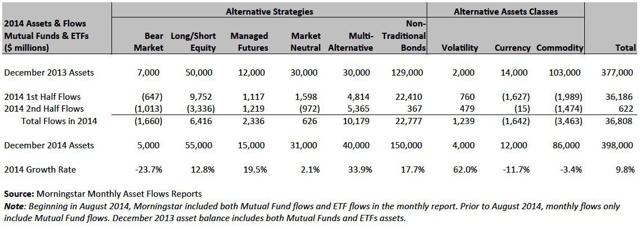 The growth of liquid alternative funds dominated all other asset classes in 2014 with a growth rate 3 times that of equity and bond funds. Based on Morningstar’s classification, and including both mutual funds and ETFs, liquid alternatives grew 10.9% in 2014, while equity funds grew at 3.4% and bond funds at a 3.7% rate. Of all the major asset classes reported by Morningstar, commodities was the only category that saw outflows, amounting to a 3.4% decline for the category. Shifting Allocations While the actual dollar amount of flows to equity and bond funds is still quite larger than that of liquid alternatives, the growth rates tell a story of shifting allocations. The growth rates highlight the fact that investors are shifting assets to liquid alternatives in favor of other asset classes as a way of diversifying their portfolios. However, with only 1.4% of the total mutual fund and ETF asset pie allocated to liquid alternatives, investors are clearly under-allocated relative to institutional investors who typically allocate 15-20% of their portfolio to alternatives. Many industry experts expect to see that 1.4% number increase to the likes of 10-15% over the coming decade, and for good reasons. The table below summarizes Morningstar’s 2014 asset flow data for mutual funds and ETFs combined: Now, let’s take a more detailed look at the winning and losing categories within the alternatives bucket. At DailyAlts, we take a slightly different view of what is alternative and what is not, and break down the categories into Alternative Strategies and Alternative Asset Classes (discussed further in this article ). Our classification process removes Trading Strategies from Mornignstar’s alternative category, and adds in Non-Traditional Bonds and Commodities. Morningstar currently classifies non-traditional bonds in the Taxable Bond category. In total, we arrive at a 9.8% growth rate for liquid alts, and total assets of $398 billion. The breakdown of 2014 flows based on this classification is below: (click to enlarge) The dominant category over the year was Morningstar’s non-traditional bond category, which took in $22.8 billion. Going into 2014, investors held the view that interest rates would rise and, thus, they looked to reduce interest rate risk and/or increase income with the more flexible non-traditional bond funds. This all came to a halt as interest rates actually declined and flows to the category nearly dried up in the second half. This also impacted market neutral strategies which are often used as a substitute for fixed income portfolios. Multi-Alternative Funds Dominate Inflows On a growth rate perspective, multi-alternative funds grew at a nearly 34% rate in 2014 and outpaced all other categories, except for volatility funds. In addition, they increased their flows in the second half over the first half, and never had a month of negative flows during the year – the only category to do so. Multi-alternative funds allocate to a wide range of alternative investment strategies, all in one fund. As a result, they serve as a one-stop shop for allocations to alternative investments. In fact, they serve the same purpose as fund-of-hedge funds serve for institutional investors, but for a much lower cost! That’s great news for retail investors. The Tale of Two Halves Finally, what is most striking is that the asset flows to alternatives all came in the first half of the year: $36.2 billion of inflows in the first half and only $622 million in the second half. Much of the second half slowdown can be attributed to two factors: A complete halt in flows to non-traditional bonds in reaction to falling rates, and billions in outflows from the MainStay Marketfield Fund (MUTF: MFLDX ), which had an abysmal 2014. The good news is that multi-alternative funds held steady from the first half to the second – a good sign that advisors and investors are maintaining a steady allocation to broad based alternative funds. The only other category to actually increase asset flows in the second half over the first was managed futures. Aside from May, every month in 2014 saw positive flows to managed futures. This consistency of flows over the year provides an indication that investors were clearly looking to diversify their portfolios with a strategy that generally has very little correlation with equity and bond markets. For many, this turned out to be a good move as a range of funds in this category performed quite well over the year. 2015 Outlook For 2015, expect to see multi-alternative funds continue to gather assets at a steady clip. The managed futures category, which grew at a healthy 19.5% in 2014 on the back of multiple difficult years, should see continued action as global markets and economies continue to diverge, thus creating a more favorable environment for these funds. Market neutral funds should also see more interest as they are designed to be immune to most of the market’s ups and downs, while long/short equity funds are positioned to take in flows from investors looking to take some equity risk off the table, but still want to participate in some upside. We will soon have a recap of January flows to see how investors behaved as the new year got kicked off. Scalper1 News
Scalper1 News