Scalper1 News
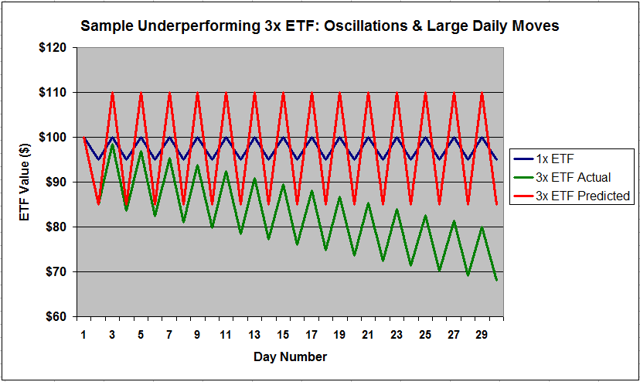
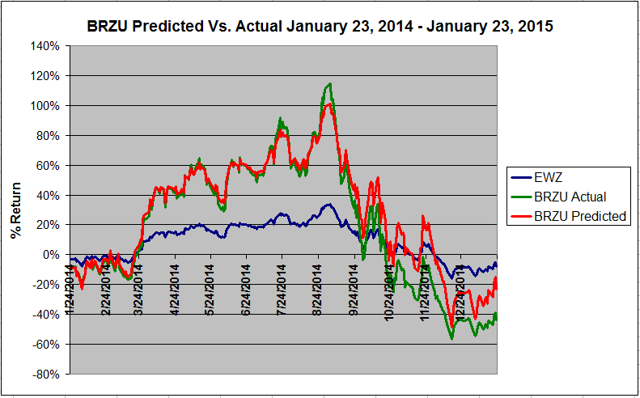
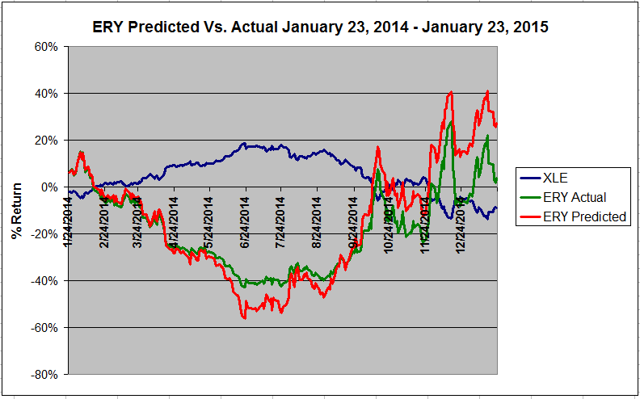
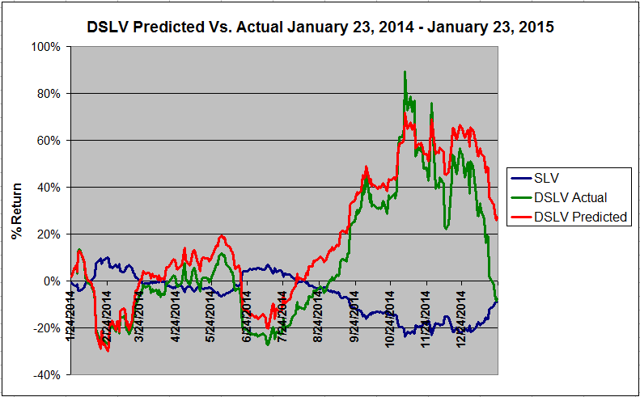
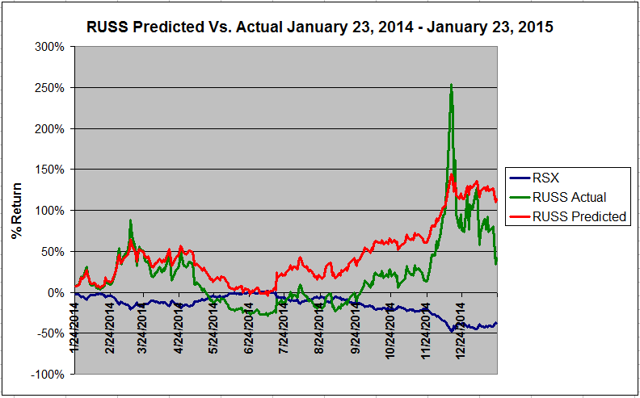
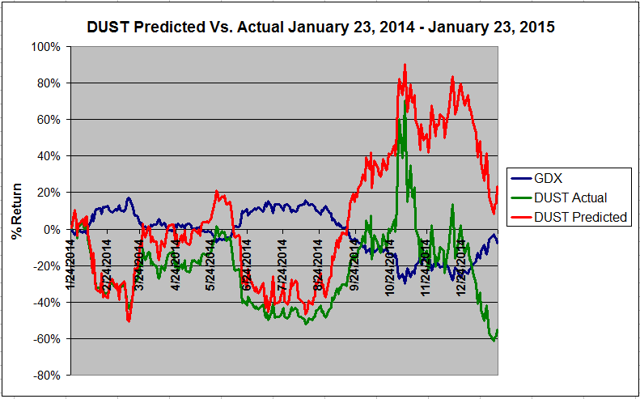
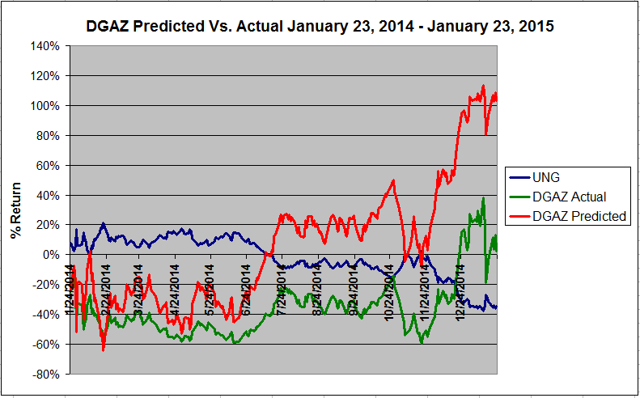
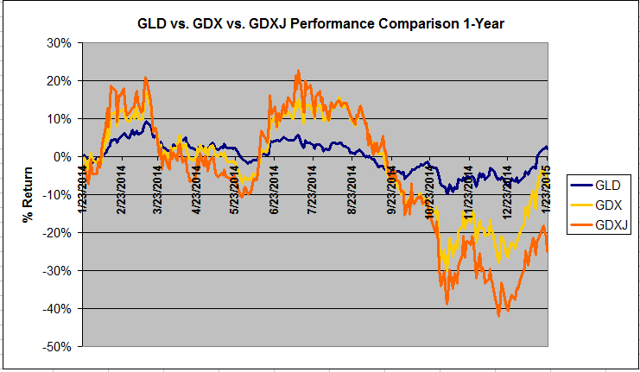
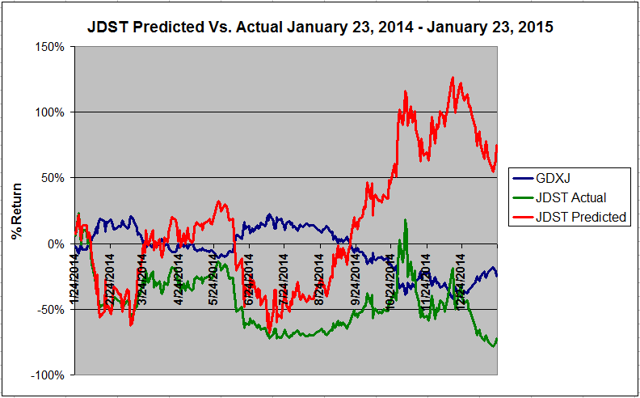
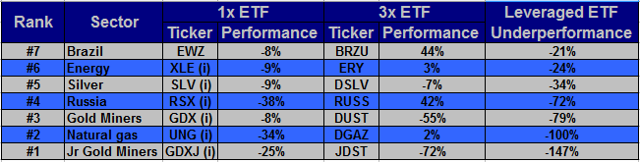 Summary Leveraged ETFs can be dangerous buy-and-hold vehicles due to their extreme volatility and tendency for many to decay over time. Leveraged ETFs underperform when their underlying indices trade with large daily moves and have multiple prices spikes and reversals. This list highlights multiple sectors ranging from international indices to precious metals to commodities whose leveraged ETFs have underperformed the 1-year returns predicted based on their 1x counterparts. These are ETFs to be avoided by all except shorterm traders due to significant underperformance on the long side and the potential for career-ending losses on the short side. Last week I published an article entitled How To Buy And Hold Leveraged ETFs: The Top 7 Outperforming 3x ETFs Over The Past Year in which I highlighted those leveraged products that saw gains greater than or equal to three times the performance of their corresponding indices and 1x ETFs. However, as traders of these volatile funds know, these were the exceptions, not the rule: the terms “outperformance” and “leveraged ETF” do not usually go hand-in-hand. Just as important as knowing which leveraged ETFs might make good long-term holds, equally crucial is knowing which diseased ETFs should be avoided like the plague. What follows is a list of the top 7 most underperforming ETFs over the last year through January 23, 2015. Again, this is not necessarily a list of the lowest returning ETFs-Rather, it is a list of ETFs that performed below the expectations set forth by their 1x companions. That is, if a 1x ETF is down 5%, the 3x leveraged ETF “should” decline by 15% or its leveraged inverse should climb by 15%. If the ETF is down more than -15% or up less than +15%, respectively, it is said to underperform. Before I delve into the list, it is a good idea to review why leveraged ETFs underperform. For a more detailed discussion on outperformance vs. underperformance, please see last week’s article. Briefly, let’s consider a fictional sector or 1x ETF that oscillates between 95 and 100 on a daily basis, or by approximately 5% daily. The corresponding 3x leveraged ETF would be expected to oscillate between 85 and 115 day after day ad infinitum. However, as Figure 1 below illustrates, after 30 days, this hypothetical ETF is actually oscillating between 65 and 80 and heading lower, thanks to some complicated mathematics associated with leveraged ETFs. (click to enlarge) Figure 1: Sample Underperforming Leveraged 3x ETF. Sectors that oscillate-that is, have large price spikes followed by big corrections-and have large average daily moves tend to have leveraged ETFs that underperform their corresponding 1x ETFs. Leveraged ETFs that underperform therefore tend to be correlated to a single commodity or index. For example, ETFs that track silver, gold, natural gas, oil, etc are based entirely around these commodities and are therefore at their mercy. These ETFs are very vulnerable to making large moves if that commodity spikes or tanks. On the other hand, ETFs that are based on an index with many components-the Nasdaq or Russell 2000, for example-tend to track closer to their corresponding ETF as it would take all of the stocks-several hundred-to surge or tank simultaneously with minimal impact if just a single stock has a big move. Another strike against leveraged commodity ETFs leading to underperformance occurs when their representative futures markets trade in contango, or when later month contracts are more expensive than the current front-month contract. These funds must sell near-term futures contracts prior to expiration and use funds from the sale to purchase more-expensive later-period contracts. Sectors that often trade in contango include natural gas and occasionally oil where monthly contangos often range from 0.5% to about 3% on average. A 1x ETF such as the The United States Natural Gas ETF, LP (NYSEARCA: UNG ) or the iPath S&P 500 VIX Short-Term Futures ETN (NYSEARCA: VXX ) will see monthly losses equaling the contango, which can be unfortunate, but not devastating. But 3x ETFs such as the VelocityShares 3x Long Natural Gas ETN (NYSEARCA: UGAZ ) see losses equal to the contango multiplied by 3, meaning that some months may see as much as a 10% degradation in value of the fund and 40-50% over the course of a typical year. Without further adieu, here are the 7 most underperforming ETFs over the last year through January 23rd. To be clear, this is not a list of short sale candidates. Although these ETFs may underperform in the longer term, massive short term fluctuations of 300-500% can rapidly wipe out a portfolio and then some. Rather, this is list of leveraged ETFs that are poor long term holds, long or short, and should be avoided for this purpose and instead be used only by short-term traders. #7: Brazil: BRZU & EWZ Kicking off our list is the nation of Brazil, a country that can’t seem to catch a break. The pre-financial crisis darling of the BRIC and emerging market investors, the country is now mired in a malaise of high inflation, rising debt, and feeble growth. After holding steady during the first portion of the year, the iShares MSCI Brazil 1x ETF (NYSEARCA: EWZ ) took a beating as falling commodity prices and the re-election of president Dilma Rousseff over the pro-business challenger Aecio Neves hit the economy hard. Energy giant Petrobas (NYSEARCA: PRB ), the eighth largest component in the index, slid 42% over the last 12 months. Overall, EWZ fell 7.8% over the last year. The 3x leveraged ETF Direxion Daily Brazil Bull (NYSEARCA: BRZU ) would have been expected to fall 23.2% based on EWZ’s performance. However, the leveraged fund ended up sliding 43.9%, an underperformance of 20.7%. Figure 2 below shows the 1-year performance of BRZU vs. predicted BRZU performance vs. EWZ. (click to enlarge) Figure 2: 3x ETF BRZU Actual Performance vs. Predicted Performance vs. 1x ETF EWZ (Source: Yahoo Finance Historical Quotes) The underperformance of BRZU vs. EWZ can best be explained by the large daily moves in EWZ. Of the 252 day period of record, there were 35 days-or about 1 in 7-during which EWZ moved > 3%, corresponding to a 9% or greater change in BRZU, which, as discussed above, hastens the decay of a leveraged ETF. #6: Oil & Gas Services: ERY (Inverse) & XLE Clocking in at number six is the oil and natural gas service sector. The profit margin of stocks in this sector is tied to the price of oil, natural gas, and other petroleum-based products. Unsurprisingly, these companies had a rough tail end of 2014. The two largest holdings in the 1x ETF Energy Select SPDR (NYSEARCA: XLE )-Exxon Mobil (NYSE: XOM ) and Chevron (NYSE: CVX )-finished the last 12 months down 8.3% and 10.4%, respectively. As a result, XLE finished the year down 9.1%, its worst year since 2008. This should have been great news for the corresponding inverse 3x leveraged ETF, the Direxion Daily Energy Bear (NYSEARCA: ERY ), which would have been predicted to rally 27.4%. However, as Figure 3 below shows, the ETF gained an anemic 3.4%, an underperformance of 23.7%. (click to enlarge) Figure 3: 3x ETF ERY Actual Performance vs. Predicted Performance vs. 1x ETF XLE (Source: Yahoo Finance Historical Quotes) The reason for the disappointing return on the inverse ETF despite XLE’s poor performance is the path that the 1x ETF took to get there, which was effectively one giant reversal. XLE finished June 2014 up 14% on the year as the price of crude held near $100/barrel, and then slid 25% during the remainder of the year as oil prices collapsed. As discussed in the introduction to this article, large oscillations result in leveraged ETF underperformance. A rally followed by a large reversal such as seen in XLE is effectively an oscillatory pattern with a period of 1. #5: Silver: DSLV (inverse) and SLV On the surface, silver would seem to be an ideal commodity on which to base a leveraged ETF. It is less volatile than oil, natural gas, or other commodities and rarely trades in Contango. Unfortunately, however, ETFs based on silver are linked to silver and only silver. While equity-based ETFs have their funds distributed among up to 100 different stocks such that choppy trading in one or more equities tends to be smoothed out, commodity ETFs, as noted in the introduction, have 100% of their holdings in a single asset class. Choppy or oscillatory trading can therefore be devastating. The 1x ETF iShares Silver Trust (NYSEARCA: SLV ) traded down 9.1% over the last 12 months as the impending end of QE weighed on precious metals. However, the path to arrive at that mark was not linear. As figure 4 below shows, SLV had two small reversals in early February and June followed by a prolonged downtrend from July through mid-November, with a sharp rebound since. Overall, the ETF has been up as much as 9% and down as much as 24% over the past year. Based on SLV’s poor performance, the 3x inverse leveraged product-VelocityShares 3x Inverse Silver ETN (NASDAQ: DSLV )-should have had a gangbuster year, predicted up 27.3%. Unfortunately for DSLV longs, not only did the ETF not track SLV appropriately, it didn’t even finish with a gain, falling 7.7% on the year, for an underperformance of 34%. Particularly devastating was the snap rally over the last two months, as DSLV was up 89% as of the close on November 5, 2014. (click to enlarge) Figure 4: 3x ETF DSLV Actual Performance vs. Predicted Performance vs. 1x ETF SLV (Source: Yahoo Finance Historical Quotes) #4: Russia: RUSS (Inverse) and RSX Unless you’ve been living under a rock for the past 12 months, you know that 2014 is a year that Russia would like to forget. The conflict with Ukraine, subsequent sanctions, and the tumbling price of crude on which the Russian economy depends stretched the nation’s finances. The top two positions in the 1x ETF MarketVectors Russia (NYSEARCA: RSX )-Lukoil and Gazprom-are both oil and gas giants and were both down more than 30% on the year. Overall, RSX dropped 38.0% on the year. The 3x leveraged Inverse ETF Direxion Daily Russia Bear 3x (NYSEARCA: RUSS ) would be expected to have surged 114% based on the performance of RSX. However, the ETF only gained 42%, an underperformance of 72%. The poor performance can be attributed again to the combination of multiple large reversals and large daily moves. Figure 5 below shows the 1-year chart of RUSS actual vs predicted performance and RSX. (click to enlarge) Figure 5: 3x ETF RUSS Actual Performance vs. Predicted Performance vs. 1x ETF RSX (Source: Yahoo Finance Historical Quotes) The chart also offers a cautionary tale to short sellers targeting leveraged ETFs. Between September 15 and December 15, the ETF rallied from $10.45 to $48.14 including an intra-day high of $64.70, a climb of 522%. #3: Gold Miners: DUST (Inverse) & GDX Number three on our list is essentially a continuation of number five. The gold miners-of which GoldCorp (GG, Toronto), Barrick Gold (ABX, Toronto), and Newmont (NYSE: NEM ) are the largest holdings–represent a leveraged play on the price of gold itself. The price of gold (NYSEARCA: GLD ) is about flat over the last 12 months-up 2.0%. However, due to a longer term decline and concerns over future demand, the MarketVectors Gold Miners ETF (NYSEARCA: GDX ) is down a modest 8.0% over the same period. Once again, this should be good news for the inverse leveraged ETF-the cleverly named Direxion Daily Gold Miners Bear 3x ETF (NYSEARCA: DUST ). Based on GDX’s negative return, DUST should have gained 24%. Instead, however, it lost a massive 55% of its value, an underperformance of 79%. Figure 6 below shows the 1-year chart of DUST actual vs predicted performance and GDX. (click to enlarge) Figure 6: 3x ETF DUST Actual Performance vs. Predicted Performance vs. 1x ETF GDX (Source: Yahoo Finance Historical Quotes) While the distribution of its assets amongst multiple stocks compared to DSLV smoothed out daily chop somewhat, the fact that gold miners are very sensitive to the price of gold makes DUST a leveraged precious metals play with large daily moves. Over the last 12 months, the mean average daily move of DUST was an impressive 4.5% with 42 days with a 10% move or better. This is a daytraders delight, but spells disaster for the longer term investor. #2: Natural Gas: DGAZ (Inverse) and UNG In the same way that the leveraged silver ETFs suffer due to their dependence on a single commodity, so too do the leveraged natural gas ETFs. However, while the daily average move in the price of silver over the last 12 months was just 0.6% per day, natural gas was significantly more volatile with an average 1.46% daily change. Overall, the 1x UNG slid 34% thanks to record high production and anemic demand. However, there were two large countertrends, one in January and a second in November, each a rally of about 30%. These oscillations with large daily moves resulted in significant degradation of the Inverse 3x leveraged product, the VelocityShares 3x Inverse Natural Gas ETN (NYSEARCA: DGAZ ). Based on UNG’s performance, DGAZ would be predicted to gain 103.1% assuming perfect 3:1 tracking. However, the fund only returned 2.3%, an awful 100.1 percentage points of underperformance. Figure 7 below shows the 1-year chart of DGAZ actual vs predicted performance and UNG. (click to enlarge) Figure 7: 3x ETF DGAZ Actual Performance vs. Predicted Performance vs. 1x ETF UNG (Source: Yahoo Finance Historical Quotes) #1: Junior Gold Minors: JDST and GDXJ Holding the dubious distinction of Underperforming 3x Leveraged ETF of the Year is the Direxion Daily Junior Gold Miners Bear 3x ETF (NYSEARCA: JDST ), the 3x Inverse leveraged counterpart of the MarketVectors Junior Gold Miners 1x ETF (NYSEARCA: GDXJ ). If GDX was a leveraged play on GLD, then GDXJ is GDX on steroids. The junior gold miners-the majority of which are international companies with market caps under $2 billion-tend to leverage their operation with a fine margin and limited cash reserves, making their share prices exquisitely sensitive to changes in the price of gold. Figure 8 below compares the 1-year performance of GLD, GDX, and GDXJ. (click to enlarge) Figure 8: GLD vs. GDX vs. GDXJ over the last year (Source: Yahoo Finance Historical Quotes) Both Gold Miner ETFs track the price of gold, although GDX moved roughly 3x-5x the price of gold while GDX was closer to 2x GLD. Overall, GLD actually finished the year nearly flat, up 2%, while GDX fell 7.7% and GDXJ slid 25%. Based on this return, it would be expected that the Inverse leveraged JDST would have rallied 75%. However, thanks to the extreme volatility and large daily moves associated with JDST, the laggard ETF ended up falling 72.4%, a disastrous underperformance of 147.5 percentage points. Figure 9 below shows the 1-year chart of JDST actual vs. predicted performance and GDXJ. (click to enlarge) Figure 9: 3x ETF JDST Actual Performance vs. Predicted Performance vs. 1x ETF GDXJ (Source: Yahoo Finance Historical Quotes) Like fellow underperformer RUSS, however, JDST saw a rally from $9.6 to $41.83 from late July to early November, a 332% gain that would have destroyed any longer term short seller. Again, this is an ETF that should be avoided by all except short-term daytraders due to the likelihood of significant underperformance on the long side and the potential for career-ending losses on the short side. Table 1 below shows a summary of the bottom 7 underperforming leveraged ETFs. (click to enlarge) Table 1: Summary of underperforming ETFs I do not currently have any positions in any of the positions discussed above. I am capable of taking my own advice. Disclosure: The author has no positions in any stocks mentioned, and no plans to initiate any positions within the next 72 hours. (More…) The author wrote this article themselves, and it expresses their own opinions. The author is not receiving compensation for it (other than from Seeking Alpha). The author has no business relationship with any company whose stock is mentioned in this article. Scalper1 News
Scalper1 News