Tag Archives: zacks funds

Homebuilder ETFs Soar On Hot-Selling Homes

There is midsummer madness in the housing market thanks to soaring demand for homes. This is especially true as existing home sales jumped at the fastest pace in eight years in June while median home prices hit a record high. U.S. existing sales climbed 3.2% to a seasonally adjusted annual rate of 5.49 million homes and much higher than the market expectation of 5.4 million. This represents the highest reading since February 2007. Meanwhile, median home price surged 6.5% year over year in June, well above the July 2006 peak on limited supply. Robust numbers reflect a brisk summer selling season and were credited to an improving economy, accelerating job growth, rising wages and the prospect of a interest rates hike later in the year. This has led to a rally in the homebuilder space. In particular, Hovnanian Enterprises (NYSE: HOV ), D.R. Horton (NYSE: DHI ), PulteGroup (NYSE: PHM ), Beazer Homes (NYSE: BZH ), and Lennar Corporation (NYSE: LEN ) are up 3.6%, 2.8%, 2.4%, 2.3%, and 2.3%, respectively. Smooth trading has also been felt in the homebuilder ETFs space, with iShares U.S. Home Construction ETF (NYSEARCA: ITB ) and SPDR S&P Homebuilders ETF (NYSEARCA: XHB ) gaining about 2% each on the day. From a year-to-date look, ITB and XHB are up 6.1% and 7.1%, respectively, and are easily outpacing the broad sector (NYSEARCA: XLB ) and broad market (NYSEARCA: SPY ) funds. XLB lost nearly 3% while SPY gained 3.8% in the same time frame. Both the homebuilder ETFs have a decent Zacks ETF Rank of 3 or ‘Hold’ rating with a High risk outlook. The upside in the homebuilder stocks was also supported by last week’s solid data including housing starts and building permits. New home construction jumped to the second-highest level since November 2007 in June while building permits surged to a near eight-year high, suggesting that housing market recovery is on high gear. Further, homebuilder confidence, as indicated by the National Association of Home Builders/Wells Fargo housing market index, remained steady at 60 in July. This marks the maximum confidence in a decade for two consecutive months. The outperformance in the homebuilding space is likely to continue in the coming months given that the residential and commercial building industry has a solid Zacks Rank in the top 40%. Investors seeking to make large profits in a short span could take look at the leveraged play – ProShares Ultra Homebuilders & Supplies ETF (NYSEARCA: HBU ) – which provides double exposure to the index of ITB. However, the fund is relatively new in the space and has low trading activity, making it a riskier and high cost choice. Original Post
Buy-Ranked Gaming ETF In Focus

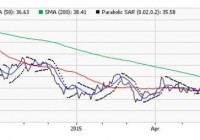
The once-thriving global gaming industry was badly hit by the slowdown in the Chinese economy that led to sluggish casino business in Macau – the world’s largest casino gaming destination. This is because the nationwide crackdown on corruption in China last year compelled Macau officials to impose restrictions on illegal money transfers in VIP gambling from mainland China to Macau. This has taken a toll on overall gambling revenues hurting the casino stocks at large. Additionally, smoking ban in casinos, tighter restrictions on visas and lower spending by high-stake gamblers added to the woes (read: 4 China A-Shares ETFs Pick Up After Gloom ). This 16-month bear trend now seems to be reversing with many casino stocks bouncing up from their lower levels. In particular, the U.S. casino giants like Las Vegas Sands (NYSE: LVS ), Wynn Resorts (NASDAQ: WYNN ), Melco Crown Entertainment Limited (NASDAQ: MPEL ) and MGM Resorts International (NYSE: MGM ) are up 4.5%, 2.6%, 5.5% and 1.5%, respectively, since the start of the second quarter. Hong Kong listed Galaxy Entertainment Group ( OTCPK:GXYEY ) added 5.6% while Sands China ( OTCPK:SCHYY ) moved higher by 15.1% so far this month. The impressive gains were brought in by the easing of tourist restrictions in Macau, and the possibility that bans on gaming-floor smoking rooms will be eased once operators maintain decorum and protect these rooms from harmful tobacco smoke. Effective July 1, mainland China passport holders transiting through Macau can stay there for two days longer and could gain entry into the city within 30 days instead of 60 days previously. This move will benefit casino operators in the months ahead. Further, the Chinese economy is stabilizing and casino operators in Macau are making efforts to diversify their businesses beyond gaming for additional revenue streams (read: ETFs to Play 3 Undervalued Sectors ). Apart from these, casino stocks seem extremely cheap at the current levels as the average valuation on Macau’s five biggest casino operators by market value has dropped to 18 times estimated earnings , about half of the peak reached in December 2013. This suggests an attractive point to enter the gaming market. Given this, investors could play this space with lower risk in a basket form rather than tilting toward individual companies. The Market Vectors Gaming ETF (NYSEARCA: BJK ) is the lone ETF providing investors global exposure to the casino gaming market. The fund has a Zacks ETF Rank of 2 or “Buy” rating with a High risk outlook (see: all the Top Ranked ETFs ). BJK in Focus This product follows the Market Vectors Global Gaming Index, holding 47 securities in its basket. It is concentrated on the top 10 holdings with the largest allocation going to Las Vegas, Galaxy Entertainment and Wynn Resorts that have combined to make up for 22.6% share. In terms of country exposure, U.S. takes the top spot at 36.8%, followed by China and Australia with 13% share each. The fund focuses on large caps at 56.2% while mid caps account for the remainder. From a style look, it has a nice mix of blend, value and growth securities, reflecting superior weightings. However, investors often overlook the fund as it has accumulated only $29.6 million in its asset base and trades in small volume of roughly 12,000 shares per day. This ensures additional cost in the form of wide bid/ask spread beyond the expense ratio of 0.65%, which is already at the higher end of the expense ratios prevailing in consumer discretionary ETF space. In terms of performance, BJK has been lagging the broad market and lost 24.2% in the trailing one-year period and 5.1% so far this year. But it recently broken its near-term range as depicted by the chart below, indicating some smooth trading in the weeks ahead. The fund’s short-term moving average (9-Day SMA) has managed to move ahead of the mid-term moving average (50-Day SMA) and is now treading toward the long-term (200-Day SMA) average, signaling upside for the fund. Further, the bullish trend is confirmed by the parabolic SAR, which is currently trading below the current price of the fund. Bottom Line Given the bullish technical indicators and improving fundamentals in Macau, investors could garner huge profits in the gaming industry with this top ranked ETF. Original post

Q2 Earnings Bring No Respite For Oil Service ETFs

The oil price carnage, which started to unsettle the investing world in the second half of 2014, is showing no sign of a retreat. Even this year, the crude issues are blazing. As a result, investors are fervently looking out for the earnings performance of oil service companies to weigh their options for an investment in energy stocks. Presently, the Zacks Industry Rank for oil service companies is in the bottom 27%. Thanks to this outright bearish backdrop, the sector is grabbing investors’ focus this earnings season, as everyone is keen on finding out the direction of oil flow. Let’s delve a little deeper into the earnings picture and see how things are shaping up for the space. In this piece, we have discussed two stocks – namely, Schlumberger Ltd. (NYSE: SLB ) and Halliburton Company (NYSE: HAL ). Between the duo, Schlumberger reported earnings on July 16, followed by Halliburton on July 20. The results were broadly mixed, with Halliburton beating on both lines and Schlumberger delivering mixed numbers. Results in Detail Halliburton, the second-largest oil service company, came up with an earnings and revenue beat in Q2. Its earnings of $0.44 per share from continuing operations beat the Zacks Consensus Estimate of $0.29. However, the bottom line deteriorated from the second-quarter 2014 adjusted earnings of $0.91 per share. The company’s revenues of $5.9 billion reflected a year-over-year decline of 26.5%, but a 0.7% beat over the Zacks Consensus Estimate. Higher profitability in Brazil, improved drilling activities in the Middle East/Asia and cost containment efforts led to the beat, despite the energy sector’s weakness. The shares were up over 1.8% in the key trading session following the results, but the slump in crude prices in the wake of a steadier greenback led the stock to shed 1.6% after-hours. Schlumberger, the world’s largest oilfield services provider, came up with a mixed Q2 with adjusted earnings of $0.88 per share (excluding special items), which edged past the Zacks Consensus Estimate of $0.79, but fell from the year-ago number of $1.37. Total revenue of $9.0 billion declined 25% year-over-year and fell shy of the Zacks Consensus Estimate of $9.1 billion. SLB retreated about 0.4% following its results, mainly reflecting the revenue weakness and failing crude prices. Market Impact The space is obviously woebegone. Still, a bottom-line beat in both firms in this downbeat operating environment can be perceived positively. While a single stock pick is always an option to play this earnings season, we could see a deep impact on ETFs that are heavily invested in these popular oil service companies (see all the Energy Equity ETFs here ). Notably, the ETF route will help investors to mitigate one company’s average performance with the other company’s stellar results. Below, we have highlighted three oil-services ETFs with considerable allocation to SLB and HAL that could be in focus following oil-service earnings: iShares U.S. Oil Equipment & Services ETF (NYSEARCA: IEZ ) This ETF, which tracks the Dow Jones U.S. Select Oil Equipment & Services Index, invests about $313 million of assets in 46 securities, focusing solely on the energy world. In-focus SLB takes the first position here, with 23.83% of holdings. Generally, when one stock accounts for as much as 23% of an ETF’s weight, its individual performance decides much of the fund’s price movement. HAL takes up the second position, with about 10.22% of total assets. The fund is off about 11.5% year-to-date (as of July 20, 2015). However, following the release of earnings by the duo, IEZ has lost about 2.4% (as of July 20, 2015). IEZ is a cheaper fund, charging 0.44% for its expense ratio. The fund has a Zacks ETF Rank #3 (Hold), with a High risk outlook. Market Vectors Oil Services ETF (NYSEARCA: OIH ) OIH tracks the Market Vectors US Listed Oil Services 25 Index. The index invests $986.7 million of assets in 26 holdings. The fund devotes as much as 22.28% of the portfolio weight to SLB, followed by 13.2% in HAL. OIH is cheap in the space, with an expense ratio of 0.35% (read: Oil Services ETFs Head-to-Head: XES vs. OIH ). The fund is down about 11.3% so far this year (as of July 20, 2015), and has lost about 2.4% since July16. OIH has a Zacks ETF Rank #3, with a High risk outlook. PowerShares Dynamic Oil & Gas Services Portfolio ETF (NYSEARCA: PXJ ) This product offers exposure to 30 energy stocks, with SLB and HAL at the second and fourth positions, respectively, allocating more than 5% of total asset to each. PXJ tracks the Dynamic Oil & Gas Services Intellidex Index, and has amassed about $58 million thus far. The ETF charges 61 bps in fees. Thus, it is slightly more expensive than some of its counterparts. The fund has lost about 3.3% following the earnings release of the two companies, and is off over 15% year-to-date. PXJ has a Zacks ETF Rank #4 (Sell), with a High risk outlook. Original Post