Tag Archives: yahoo

NUO Offers Some Decent Yields, But I Have Several Concerns About It
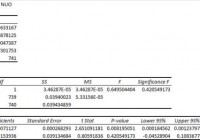
Summary I’m taking a look at NUO as a candidate for inclusion in my ETF portfolio. I don’t like the expense ratio. The correlation to SPY is almost nothing and it is based on reasonable trade volumes. The credit ratings of the portfolio seem fine, but the high duration and persistent discount to NAV concern me. I’m not assessing any tax impacts. Investors should check their own situation for tax exposure. Investors should be seeking to improve their risk adjusted returns. I’m a big fan of using ETFs to achieve the risk adjusted returns relative to the portfolios that a normal investor can generate for themselves after trading costs. I’m working on building a new portfolio and I’m going to be analyzing several of the ETFs that I am considering for my personal portfolio. One of the funds that I’m considering is the Nuveen Ohio Quality Income Municipal Fund (NYSE: NUO ). I’ll be performing a substantial portion of my analysis along the lines of modern portfolio theory, so my goal is to find ways to minimize costs while achieving diversification to reduce my risk level. What does NUO do? NUO attempts to provide current income that is exempted from regular federal and Ohio income tax. At least 80% of the assets are invested in investment grade municipal bonds. The other 20% may be invested in bonds that are not rated if the investment adviser believes their characteristics are similar to those of investment grade municipal bonds. NUO falls under the category of “Muni Ohio.” Does NUO provide diversification benefits to a portfolio? Each investor may hold a different portfolio, but I use the SPDR S&P 500 Trust ETF (NYSEARCA: SPY ) as the basis for my analysis. I believe SPY, or another large cap U.S. fund with similar properties, represents the reasonable first step for many investors designing an ETF portfolio. Therefore, I start my diversification analysis by seeing how it works with SPY. I start with an ANOVA table: (click to enlarge) The correlation is beautiful at 3%. Extremely low levels of correlation are wonderful for establishing a more stable portfolio. For equity securities an extremely low correlation is frequently only found when there are substantial issues with trading volumes that may distort the statistics. Bonds should have dramatically lower levels of correlation, but I’m still quite happy with this. NUO is an ETF that is heavily invested in bonds, so the low correlation for it should be less surprising than a similar correlation from an ETF that is invested in equity. Standard deviation of daily returns (dividend adjusted, measured since January 2012) The standard deviation is .6859% for NUO. For SPY, it is .7300% for the same period. SPY usually beats other ETFs in this regard. However, I would have hoped for a little less volatility. The real test for a bond portfolio is looking at the duration and seeing how vulnerable it is to changes in interest rates. Liquidity looks acceptable Average trading volume isn’t very high, a bit over 22,000, but that also isn’t low enough to be a major concern for me. It is higher than I had expected when I saw the low correlation and saw that the bond was being designed for tax exemption for a single state. I thought liquidity might be weaker because of the more specialized nature of the ETF, but it isn’t too bad in my opinion. In my sample period of nearly 3 years, there were no days in which the dividend adjusted close was exactly equal to the value it had on the previous day. The lack of days with no change suggests that low liquidity is not driving the low correlation. Mixing it with SPY I also run comparisons on the standard deviation of daily returns for the portfolio assuming that the portfolio is combined with the S&P 500. For research, I assume daily rebalancing because it dramatically simplifies the math. With a 50/50 weighting in a portfolio holding only SPY and NUO, the standard deviation of daily returns across the entire portfolio is .5082%. With 80% in SPY and 20% in NUO, the standard deviation of the portfolio would have been .6038%. If an investor wanted to use NUO as a supplement to their portfolio, the standard deviation across the portfolio with 95% in SPY and 5% in NUO would have been .6954%. Why I use standard deviation of daily returns I don’t believe historical returns have predictive power for future returns, but I do believe historical values for standard deviations of returns relative to other ETFs have some predictive power on future risks and correlations. Yield & Taxes The distribution rate is 5.72%. This ETF could be worth considering for retiring investors. I like to see strong yields for retiring portfolios because I don’t want to touch the principal. By investing in ETFs I’m removing some of the human emotions, such as panic. Since this is an investment in bonds through an ETF, over the long term capital appreciation should not be expected. In my opinion, investing in SPY provides a reasonable level of dividend yield with a substantial amount of average appreciation over time. For a retiring investor, it may be desirable to have stronger yields at the cost of appreciation. One way to do that is to include some bond ETFs. I intend to include quite a few of them in my portfolio. The exposure level will probably be in the 20 to 30% range. Some advisors would suggest that I should have fewer bonds since I am so far away from retirement, but I believe the lower correlation makes it imperative to include at least a small bond position in reaching the efficient frontier. I’m not a CPA or CFP, so I’m not assessing any tax impacts. The description of the ETF states that it intends to produce income that is exempt from taxation in Ohio, but I am not qualified to determine if that goal is being met. The portfolio I am constructed will be in a tax advantaged account, so I am not concerned about avoiding taxes on interest, dividends, or gains. Expense Ratio The ETF is posting 2.15 % for a gross expense ratio, and 1.10% for a net expense ratio. I want diversification, I want stability, and I don’t want to pay for them. This is what I would consider an unattractive expense ratio. Market to NAV The ETF is at a 9.66% discount to NAV currently. Premiums or discounts to NAV can change very quickly so investors should check prior to putting in an order. Over the last month the average discount was 9.56% and over the last year it was 6.78%. I’m curious about the reason for that substantial discount. Normally I would expect fair market values for the individual investments used in calculating NAV, but I’m curious about this one. It may be fun to look for anything that would merit that discount. Credit Ratings The bond ratings aren’t too bad in my opinion, but I’m also currently holding a fund filled with junk bonds. Many readers may have much higher requirements for credit ratings when investing in debt. (click to enlarge) Conclusion I’m currently screening a large volume of ETFs for my own portfolio. The portfolio I’m building is through Schwab. I have a strong preference for researching ETFs that are free to trade in my account, so most of my research will be on ETFs that fall under the “ETF OneSource” program. I have not seen this ETF listed for the OneSource program. I love the correlation, but I’ll need to test the correlation with other bond ETFs as I work to select a batch of bond ETFs that are neither highly correlated to the market nor to each other. I do have a few major concerns here. The first is that I don’t want to give up any yield to acquire tax free status on bonds that are going into a tax advantaged account. The second is that the expense ratio feels really high. The third is that discount to NAV is both substantial and sustained, so I would want to find the cause of the discount. The fourth is that the average effective duration is 8.84 years. One of the reasons I use junk bonds is so I can acquire a respectable yield while maintaining a substantially lower duration. I’m not expecting NUO to make the final cut, but I’m going to keep on my list because I want to see how it performs relative to other bond ETFs in the portfolio simulations. Additional disclosure: Information in this article represents the opinion of the analyst. All statements are represented as opinions, rather than facts, and should not be construed as advice to buy or sell a security. Ratings of “outperform” and “underperform” reflect the analyst’s estimation of a divergence between the market value for a security and the price that would be appropriate given the potential for risks and returns relative to other securities. The analyst does not know your particular objectives for returns or constraints upon investing. All investors are encouraged to do their own research before making any investment decision. Information is regularly obtained from Yahoo Finance, Google Finance, and SEC Database. If Yahoo, Google, or the SEC database contained faulty or old information it could be incorporated into my analysis. The analyst holds a diversified portfolio including mutual funds or index funds which may include a small long exposure to the stock.
ENFR Is An Energy Sector ETF That Might Fit Very Well Under Modern Portfolio Theory

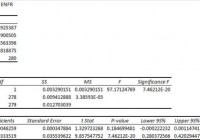
Summary I’m taking a look at ENFR as a candidate for inclusion in my ETF portfolio. The correlation to SPY is incredibly low but poor liquidity is reducing the reliability of statistics. The expense ratio is high and the holdings within the ETF could use more diversification. I wasn’t planning on using energy ETF, but the low correlation is too appealing. I’m not assessing any tax impacts. Investors should check their own situation for tax exposure. Investors should be seeking to improve their risk adjusted returns. I’m a big fan of using ETFs to achieve the risk adjusted returns relative to the portfolios that a normal investor can generate for themselves after trading costs. I’m working on building a new portfolio and I’m going to be analyzing several of the ETFs that I am considering for my personal portfolio. One of the funds that I’m considering is the Alerian Energy Infrastructure ETF (NYSEARCA: ENFR ). I’ll be performing a substantial portion of my analysis along the lines of modern portfolio theory, so my goal is to find ways to minimize costs while achieving diversification to reduce my risk level. What does ENFR do? ENFR attempts to track the total return (before fees and expenses) of the Alerian Energy Infrastructure Index. At least 90% of the assets are invested in funds included in this index. There are only 30 equity securities included in the index, so I’m expecting some diversification and volatility issues. ENFR falls under the category of “Energy Limited Partnership”. Does ENFR provide diversification benefits to a portfolio? Each investor may hold a different portfolio, but I use (NYSEARCA: SPY ) as the basis for my analysis. I believe SPY, or another large cap U.S. fund with similar properties, represents the reasonable first step for many investors designing an ETF portfolio. Therefore, I start my diversification analysis by seeing how it works with SPY. I start with an ANOVA table: (click to enlarge) The correlation appears incredible at 51%. I want to see low correlations on my investments. Extremely low levels of correlation are wonderful for establishing a more stable portfolio. I consider anything under 50% to be extremely low. However, for equity securities an extremely low correlation is frequently only found when there are substantial issues with trading volumes that may distort the statistics. The statistics appear too good to be true, which usually indicates that they are. I’ll keep an eye out for things that could distort the numbers. Standard deviation of daily returns (dividend adjusted, measured since November 2013) The standard deviation is very high for the relative calm sample period. For ENFR it is .9802%. For SPY, it is 0.6748% for the same period. While I’ve covered quite a few ETFs where the standard deviation was greater than 1%, those scores usually came from periods where SPY would have a standard deviation higher than .7200%. However, if the correlation really is 51%, I could work with the high deviations. Liquidity is a problem Average trading volume is running around 10,000 shares per day. It’s not completely illiquid, but it is pretty bad. In that time period, slightly under 280 trading days, the ETF reported a change from one closing value to the next (dividend adjusted) of 0.00% on 12 occasions. That might indicate days in which no shares changed hands, or the ending price might just have been the same as the prior day because of coincidence. For SPY, it happened 0 times during that period. However, SPY also trades at a much higher share price which reduces the chance of randomly having the same closing price since a one cent change in share price represents a smaller percentage of the price. The presence of 12 days in a sample of 280 is enough that it could have a meaningful influence on the calculated standard deviation and correlation of returns. I don’t think the poor liquidity is enough to explain away the correlation only being 51%, but it does reduce the reliability of the statistics. Mixing it with SPY I also run comparisons on the standard deviation of daily returns for the portfolio assuming that the portfolio is combined with the S&P 500. For research, I assume daily rebalancing because it dramatically simplifies the math. With a 50/50 weighting in a portfolio holding only SPY and ENFR, the standard deviation of daily returns across the entire portfolio is 0.7227%. With 80% in SPY and 20% in ENFR, the standard deviation of the portfolio would have been .6615%. If an investor wanted to use ENFR as a supplement to their portfolio, the standard deviation across the portfolio with 95% in SPY and 5% in ENFR would have been .6673%. Why I use standard deviation of daily returns I don’t believe historical returns have predictive power for future returns, but I do believe historical values for standard deviations of returns relative to other ETFs have some predictive power on future risks and correlations. Yield & Taxes The distribution yield is 1.97%. I like to see strong yields for retiring portfolios because I don’t want to touch the principal. By investing in ETFs I’m removing some of the human emotions, such as panic. Higher yields imply lower growth rates (without reinvestment) over the long term, but that is an acceptable trade off in my opinion. The poor liquidity would still concern me for any investor that needed even a moderate level of liquidity in the portfolio. I’m not a CPA or CFP, so I’m not assessing any tax impacts. Expense Ratio The ETF is posting an expense ratio of .65%. I want diversification, I want stability, and I don’t want to pay for them. I’m not attracted to the high expense ratio, but I won’t eliminate the ETF on the grounds of a high expense ratio because I’m still intrigued by the very low correlation. Market to NAV The ETF is at a .07% premium to NAV currently. Premiums or discounts to NAV can change very quickly so investors should check prior to putting in an order. I wouldn’t consider .07% to be meaningful, but investors should still watch out for the bid-ask spread. Poor liquidity is frequently connected with larger spreads. Largest Holdings The diversification within the ETF is fairly bland. I expected that because the underlying index had a fairly limited number of securities as well. In my opinion, the most reasonable way to use this ETF would be as a fairly small position within a large portfolio in which the investor was willing to sink in a little time watching for the right times to enter. Specifically, they would need to be watching the spread and the premium or discount to NAV. Additionally, the investor would need to be aware of their risk tolerances and liquidity needs. For an investor that meets all those criteria, this ETF might work. (click to enlarge) Conclusion I’m currently screening a large volume of ETFs for my own portfolio. The portfolio I’m building is through Schwab, so I’m able to trade ENFR with no commissions. I have a strong preference for researching ETFs that are free to trade in my account, so most of my research will be on ETFs that fall under the “ETF OneSource” program. I’m going to keep ENFR on my list as a potential candidate despite the fairly poor liquidity and high expense ratio. I don’t have a portion of the portfolio set aside for energy stocks, so the odds may be stacked against ENFR. If ENFR is selected, it would probably be used as 3% to 5% of the portfolio value. The major incentive for me is the low correlation, so I would want to run more statistical testing on the correlation over different time periods to reduce the risk of poor liquidity creating a misleading picture. Additional disclosure: Information in this article represents the opinion of the analyst. All statements are represented as opinions, rather than facts, and should not be construed as advice to buy or sell a security. Ratings of “outperform” and “underperform” reflect the analyst’s estimation of a divergence between the market value for a security and the price that would be appropriate given the potential for risks and returns relative to other securities. The analyst does not know your particular objectives for returns or constraints upon investing. All investors are encouraged to do their own research before making any investment decision. Information is regularly obtained from Yahoo Finance, Google Finance, and SEC Database. If Yahoo, Google, or the SEC database contained faulty or old information it could be incorporated into my analysis. The analyst holds a diversified portfolio including mutual funds or index funds which may include a small long exposure to the stock.

ACIM Appears To Have Incredibly Low Risk, But That’s Inaccurate

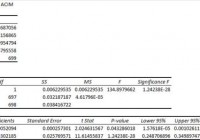
Summary I’m taking a look at ACIM as a candidate for inclusion in my ETF portfolio. The correlation appears to be very low, but the low liquidity caused days with no trades. The same liquidity issues might have improved the standard deviation of returns. The premium to NAV makes it look like a potential short candidate. I’m not assessing any tax impacts. Investors should check their own situation for tax exposure. Investors should be seeking to improve their risk adjusted returns. I’m a big fan of using ETFs to achieve the risk adjusted returns relative to the portfolios that a normal investor can generate for themselves after trading costs. I’m working on building a new portfolio and I’m going to be analyzing several of the ETFs that I am considering for my personal portfolio. One of the funds that I’m considering is the SPDR® MSCI ACWI IMI ETF (NYSEARCA: ACIM ). I’ll be performing a substantial portion of my analysis along the lines of modern portfolio theory, so my goal is to find ways to minimize costs while achieving diversification to reduce my risk level. What does ACIM do? ACIM attempts to track the total return of the MSCI ACWI IMI Index. At least 80% of funds are invested in companies that are part of the index, or in ADRs (American Depositary Receipts). ACIM falls under the category of “World Stock”. Does ACIM provide diversification benefits to a portfolio? Each investor may hold a different portfolio, but I use (NYSEARCA: SPY ) as the basis for my analysis. I believe SPY, or another large cap U.S. fund with similar properties, represents the reasonable first step for many investors designing an ETF portfolio. Therefore, I start my diversification analysis by seeing how it works with SPY. I start with an ANOVA table: (click to enlarge) The correlation is an absurdly low 40%. If an investor stopped here, they would be dramatically misinformed about the risks of ACIM. The correlation is very low as a statistical measure, but the metric is being substantially enhanced by a lack of liquidity in the stock which caused several days to report no change in the price of securities. Standard deviation of daily returns (dividend adjusted, measured since March 2012) The standard deviation is excellent for the international exposure. For ACIM it is .9981%. For SPY, it is 0.7419% for the same period. SPY usually beats other ETFs in this regard, so having a lower standard deviation is excellent. Frequent readers should be aware that I have measured returns from March 2012 instead of my normal starting point of January 2012. I can’t measure values until the ETF is trading and Yahoo is tracking the dividend adjusted close values. Unfortunately, the standard deviation may appear substantially smaller than it should because several days (especially in 2012) reported no change in price. When no sales are reported, the price is not changed and it looks like a low standard deviation of returns. Investors should be aware that there is substantial liquidity risk. The average volume for the last 10 days is only 6,837. Mixing it with SPY I also run comparisons on the standard deviation of daily returns for the portfolio assuming that the portfolio is combined with the S&P 500. For research, I assume daily rebalancing because it dramatically simplifies the math. With a 50/50 weighting in a portfolio holding only SPY and ACIM, the standard deviation of daily returns across the entire portfolio is 0.7320%. If an investor wanted to use ACIM as a supplement to their portfolio, the standard deviation across the portfolio with 95% in SPY and 5% in ACIM would have been .7263%. However, due to the very low correlation, a position of 80% SPY combined with 20% ACIM results in a standard deviation for the portfolio of only .6982%. Investors hoping to capitalize on this low standard deviation of returns would need to have a relatively low need for liquidity since the price stability only works if no large sell orders are being introduced. Why I use standard deviation of daily returns I don’t believe historical returns have predictive power for future returns, but I do believe historical values for standard deviations of returns relative to other ETFs have some predictive power on future risks and correlations. Yield & Taxes The distribution yield is 1.84%. The yield is almost high enough for a retiring investor, in my opinion. Generally, I want to see yields over 2% when considering an ETF for retirement planning. This is close enough that I could still consider it from the perspective of a retiree, but only if the retiree was certain they did not have liquidity needs. I’m not a CPA or CFP, so I’m not assessing any tax impacts. Expense Ratio The ETF is posting .25% for an expense ratio. I want diversification, I want stability, and I don’t want to pay for them. The expense ratio on this fund is higher than I want to pay, but isn’t unbearable for the incredible diversification. Market to NAV The ETF is at a 1.85% premium to NAV currently. Premiums or discounts to NAV can change very quickly so investors should check prior to putting in an order. I wouldn’t want to pay a premium greater than .1% when investing in an ETF. There might be some situations where I would pay .2%, but you won’t see me agreeing to pay that premium. Not happening. If I took a position in this ETF it would be with a carefully monitored limit buy order that adjusted for the premium. If sell orders dropped it to my price, great, if not, I’d rather avoid the ETF entirely than pay that premium. Largest Holdings ACIM has great diversification when you look at the percent in each asset, but the top of the portfolio still has a huge tilt towards the U.S. economy. (click to enlarge) These aren’t bad stocks to hold, but I can get them by holding any of several major ETFs that hold major U.S. companies. The appeal of a world portfolio is having substantial exposure to other markets to help balance out the geographic risks of a U.S. based portfolio. This collection of top holdings supports my belief that the correlation is understated because favorable impacts from days where reported closing price did not change. If ACIM drops to trade at a discount to NAV, I may become very interested in it. Otherwise, regardless of the statistics, I’m not interested in paying a premium for an ETF that holds several of the same companies I can acquire without the premium. Conclusion I’m currently screening a large volume of ETFs for my own portfolio. The portfolio I’m building is through Schwab, so I’m able to trade ACIM with no commissions. I have a strong preference for researching ETFs that are free to trade in my account, so most of my research will be on ETFs that fall under the “ETF OneSource” program. I think the statistics for the ETF are misleading and premium to NAV looks like a poor bet for future returns. When this ETF trades near NAV, it may have some value to investors. I may take a deeper look at it in the future, but for now I think the low liquidity and premium NAV present a real challenge to including it in my portfolio. Due to low liquidity and the potential need to execute a trade over multiple days to create or sell a reasonable position, I would not consider this ETF at all from any account that was required to pay trading commissions on the ETF. If I can short ETFs that are overpriced (without commission), it might become appealing to initiate shorts on the ETF when it is trading over book value if I can own substantially the same securities through other ETFs without paying a premium to acquire them. Additional disclosure: Information in this article represents the opinion of the analyst. All statements are represented as opinions, rather than facts, and should not be construed as advice to buy or sell a security. Ratings of “outperform” and “underperform” reflect the analyst’s estimation of a divergence between the market value for a security and the price that would be appropriate given the potential for risks and returns relative to other securities. The analyst does not know your particular objectives for returns or constraints upon investing. All investors are encouraged to do their own research before making any investment decision. Information is regularly obtained from Yahoo Finance, Google Finance, and SEC Database. If Yahoo, Google, or the SEC database contained faulty or old information it could be incorporated into my analysis. The analyst holds a diversified portfolio including mutual funds or index funds which may include a small long exposure to the stock.