Tag Archives: utilities

Not Your Father’s Low Volatility Strategy

By Fei Mei Chan Low volatility strategies were a popular and growing category in 2015, and if the first several days of 2016 are any indication, it wouldn’t be surprising to see their popularity continue in the New Year. That said, the topic of low volatility investing often comes with much discourse. A frequent argument is that a low volatility tilt is very similar, if not synonymous, to a bet on a small number of sectors or industries. In its 25-year history, the S&P 500 Low Volatility Index has often had high concentration in low volatile sectors – most frequently Utilities, Financials, and Consumer Staples. The index seeks out the least volatile stocks – with no sector constraints – so having large positions in sectors with relatively lower risk is not surprising. However, there’s more to the low volatility story than a sector bet . As an exercise, we produce a hypothetical low volatility portfolio whose sector weights match those of the S&P 500 Low Volatility Index but whose sector returns match those of the complete S&P 500. The hypothetical results tell us to what extent Low Vol’s results come from sector tilts alone, vs. stock selection within sectors. As shown below, over the last 25 years, the hypothetical portfolio’s standard deviation was between those of the S&P 500 and the S&P 500 Low Volatility Index. Being in the Low Vol’s sectors during this period accounted for more than two-thirds of the total volatility reduction achieved by the S&P 500 Low Volatility Index. In the same period, the return increment attributed to being in the “correct” sector was only 24%. More than three-quarters of Low Vol’s outperformance is idiosyncratic to its stock selection methodology. We’re not alone in arguing for the existence of the low volatility effect independent of sector impacts. Baker, Bradley, and Taliaferro , in decomposing the low risk anomaly, found that stock selection contributed to higher alpha, while the contribution from industry selection was negligible. Asness, Frazzini and Pedersen concluded that even holding the industry effect neutral, low volatility bets exhibited positive returns. The implication of all this research is that a sector tilt can’t account for all the performance differentials of low volatility. To assume that the two strategies are synonymous is to leave something on the table. Disclosure: © S&P Dow Jones Indices LLC 2015. Indexology® is a trademark of S&P Dow Jones Indices LLC (SPDJI). S&P® is a trademark of Standard & Poor’s Financial Services LLC and Dow Jones® is a trademark of Dow Jones Trademark Holdings LLC, and those marks have been licensed to S&P DJI. This material is reproduced with the prior written consent of S&P DJI. For more information on S&P DJI and to see our full disclaimer, visit www.spdji.com/terms-of-use .

Recommended Stock And Bond ETF/Fund Choices For Best Future Gains

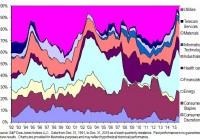
Stocks May Be a Slightly Better Bet in 2016 In my July 2, 2015 article on Seeking Alpha, I presented my then up-to-date Model Portfolio for Stock ETFs/funds. In this article, I will update my recommendations and include my latest Model Portfolio for Bonds along with my overall asset allocations. In spite of the perils of forecasting, I am raising my quarterly overall allocation to stocks, but just a tad. The main reason is merely because, although I don’t anticipate much better returns for stocks in 2016 than in 2015, using a 3 to 5 year horizon (my target range), stocks present a more favorable outlook than for bonds, and certainly, than for cash. The ongoing trend one-year trend for stocks, something I watch carefully, is now negative. While one year’s returns likely don’t show much of relationship to the following year’s performance, the high returns observed between 2009 and 2014 have led to a highly priced market. As a result, future returns are more likely, in my opinion, to be somewhat subdued. Here are my overall allocation recommendations, as subdivided into 3 rough categories based on one’s self-estimated tolerance for risk. For Moderate Risk Investors Asset Current (Last Qtr.) Stocks 52.5% (50%) Bonds 35 (35) Cash 12.5 (15) For Aggressive Risk Investors Asset Current (Last Qtr.) Stocks 67.5% (65%) Bonds 22.5 (22.5) Cash 10 (12.5) For Conservative Investors Asset Current (Last Qtr.) Stocks 20% (15%) Bonds 50 (50) Cash 30 (35) January 2016 Model Stock Fund Portfolio Value vs. Growth Categories Okay, fans of Large Growth funds, you’ve been consistently beating Large Value funds when looking at annualized past five year returns every January going all the back to Jan. 2010. That’s quite a string. This means if you over weighted the average Large Growth fund as early as Jan. 2005 and held that over weighted position throughout, your returns would have exceeded the average Large Value fund by about 2% each year, and the average of all U.S. diversified categories of funds by about 1% a year. What gives, and can the streak continue? Large Growth funds tend to contain heavy doses of Technology stocks as well as Consumer Cyclical stocks. Large Value funds are particularly attracted to Financial Services stocks, with more of a commitment toward Energy and Utility stocks. Both Technology and Consumer Cyclical have done quite well over the last 10 years, Utilities, Energy, and especially Financials, have not. As you probably are aware, Energy stocks have done particularly poorly over the last two years, while Financials took a particularly severe beating during the 2007-08 financial crisis and have been much slower to recover strongly since then compared to stocks as a whole. I have been overweighing Large Value over Large Growth for several years now which, up to now, hasn’t paid off. While both categories have done well, the average Large Growth fund has beaten the average Large Value fund by about 4% annually over the last 3 years. But, according to my proprietary research, while both categories should do adequately in the years ahead, Large Growth still comes out a little better on my list of most recommended US stock categories. The biggest question mark for value funds appears to be whether financial stocks, often their biggest component, can bounce off a relatively underperforming 2015, not to mention whether energy and utility stocks held in lesser amounts, can get back to anywhere near positive returns. In light of the continuing somewhat iffy prospects for Large Value funds, I am dropping my recommended allocation to 17.5% from 20%. Instead, I recommend putting the freed-up money into the Fidelity Contra Fund (MUTF: FCNTX ). I am also dropping my allocation to the Vanguard Financials ETF (NYSEARCA: VFH ) since our Large Value holdings already cover this sector. International Stock Funds Given the stronger prospects for most international funds as compared to U.S. stocks (described in my recent Jan. 2016 Seeking Alpha article “Best Stock ETF/Fund Categories For Future Gains”), I suggest a bumped up allocation to the former. U.S. stock funds, on average, have performed considerably better than international ones going back as far as 10 years. So, it might appear that I am running the risk of acting “prematurely” by going to an even higher international recommendation than before. This is always the chance one takes when one starts to favor underperforming categories under the assumption that they are “due” to turn things around. But my research suggests that more frequently than not, it is usually more important to recognize potential undervaluation in a category than to always wait for strong positive momentum trends before investing. Thus, while emerging market stocks currently have strong negative momentum, my research suggests that they offer among the best prospects for longer-term investors (along with some badly beaten up sector funds), but both mainly for Aggressive investors. It is interesting to note that stock markets in the Euro zone had a much better year in 2015 than US stock markets with a main index of European stocks up about 8%. However, for US investors, the increase in the value of the dollar vs. the Euro resulted in much of those gains being wiped away, unless you were invested in a European fund that hedges its currency exposure, such as the WisdomTree Europe Hedged Equity ETF ( HEDJ) mentioned below. Our Specific Fund and Allocation Recommendations Now (vs Last Qtr.) Fund Category Recommended Category Weighting Now (vs Last Qtr.) Fidelity Low Priced Stock Fund (MUTF: FLPSX ) 10% (12.5%) Mid-Cap/ Small Cap 10% (12.5%) Fidelity Overseas Fund (MUTF: FOSFX ) 5 (0) (New!) Vanguard Europe Index Fund (MUTF: VEURX ) 5 (10) Vanguard Pacific Index Fund (MUTF: VPACX ) 10 (10) Tweedy, Browne Global Value Fund (MUTF: TBGVX ) 5 (5) Vanguard Emerging Markets Stock Index Fund (MUTF: VEIEX ) 10 (7.5) DFA International Small Cap Value Portfolio (MUTF: DISVX ) 5 (2.5) (See Notes 1, 2 and 3.) International 40 (35) Fidelity Large Cap Stock Fund (MUTF: FLCSX ) 7.5 (7.5) Vanguard 500 Index Fund (MUTF: VFINX ) 7.5 (7.5) Large Blend 15 (15) Vanguard Growth Index Fund (MUTF: VIGRX ) 7.5 (7.5) Fidelity Contra 7.5 (5) Large Growth 15 (12.5) T. Rowe Price Value Fund (MUTF: TRVLX ) 5 (7.5) Vanguard Equity Income Fund (MUTF: VEIPX ) 7.5 (0) (New!) Vanguard U.S. Value Fund (MUTF: VUVLX ) 5 (5) Large Value 17.5 (20) Vanguard Energy Fund (MUTF: VGENX ) 2.5 (2.5) Sector 2.5 (5) Notes: ETFs (exchange traded funds) of the same category can be substituted for any of the above Vanguard index funds; e.g. the Vanguard FTSE Europe ETF (NYSEARCA: VGK ) can be substituted for VEURX. Although not included in the Model Portfolio, you may want to consider two other (or additional) international ETFs: the WisdomTree Europe Hedged Equity ETF (NYSEARCA: HEDJ ) and the WisdomTree Japan Hedged Equity ETF (NYSEARCA: DXJ ). These ETFs, unlike the Vanguard Europe and Pacific funds, tend to do better when the US dollar is strong, as it has been since roughly mid-2011. January 2016 Model Bond Fund Portfolio Comments on Our Updated Bond Recommendations Our bond fund recommendations remain highly similar to last quarter’s recommendations. (Note: If you wish to see the Oct. 2015 recommendations, you can go to this link .) We are increasing our allocation to the Vanguard Intermediate-Term Tax-Exempt Fund as muni bonds seem to be one of the best options for both safe and decent after-tax yields. Since gradually rising interest rates could potentially hurt bond fund prices, we are sticking with short and intermediate term maturity funds. (Long-term bond funds have generally done a little worse in 2015 than short and intermediate term funds.) We are dropping Metropolitan West Total Return Bond Fund, included in the last Portfolio, because its performance has not exceeded that of the major bond benchmark, the Barclays US Aggregate Bond Index (AGG). Our Specific Fund and Allocation Recommendations Now (vs Last Qtr.) Fund Category Recommended Category Weighting Now (vs Last Qtr.) PIMCO Total Return Fund (MUTF: PTTRX ) 25% (25%) Harbor Bond Fund (MUTF: HABDX ) 0 (0) (See Note 1.) PIMCO Total Return ETF (NYSEARCA: BOND ) 5 (5) Diversified 30% (35%) DoubleLine Total Return Bond Fund (MUTF: DBLTX ) 7.5 (7.5), or DoubleLine Total Return Bond Fund (MUTF: DLTNX ) (See Note 2.) Interm. Term 7.5 (7.5) Vanguard Intermediate-Term Tax-Exempt Fund (MUTF: VWITX ) 17.5 (15) Interm. Term Muni 17.5 (15) Vanguard Short Term Investment Grade Fund (MUTF: VFSTX ) 10 (7.5) Short-Term Corp. 10 (7.5) Vanguard High Yield Corporate Fund (MUTF: VWEHX ) 10 (10) High Yield 10 (10) PIMCO Foreign Bond Fund (U.S. Dollar-Hedged) (MUTF: PFRAX ) 25 (25) International 25 (25) Notes: When possible, select PTTRX; HABDX is only recommended if you cannot met PTTRX’s minimum. The two funds are the same but have different minimums; select DBLTX if possible because of lower expense ratio.

Best Stock ETF/Fund Categories For Future Gains

I’ll start with the good news. The overall market, including nearly all subcategories of ETFs/funds, especially international ones, is no longer at what I previously felt was a dangerously high level. One year of relatively flat, or even negative returns, have helped restore fund performance to more sustainable levels. (However, more traditional measures of stock valuation, such as forward-looking price to earnings ratios remain elevated – over 17, vs. the long-term average of about 14 for the S&P 500, according to bloomberg.com). I look at both stock valuations and on-going momentum as important yardsticks in judging the relative attractiveness of a particular stock fund and its overall category. While over- vs. under-valuation tends to arise as a result of long-term factors, momentum (relatively positive or negative) can be regarded as more short-term in nature. Given this, I place somewhat more importance on valuation issues than momentum in determining which stock fund categories look the most and least promising over the next several years at any given point. Now for the not-so-good news: Unfortunately, most stock ETF/fund categories, while not appearing excessively overvalued, don’t appear undervalued either. Of course, any time stocks are undervalued, they can be assumed to have much better prospects than if they are overvalued, or even fairly valued. At the same time, virtually every category of stocks has lost the momentum they exhibited in early 2015. My most favored and least favored stock category selection procedures do not employ the use of economic variables, such as GDP, level of interest rates, etc. However, since stocks often become over- vs. under-valued or momentum-impacted based on investors’ reactions to such data, my procedures do, in a sense, indirectly reflect such variables. Using my proprietary selection procedures has resulted in my specific fund selections outperforming an equivalently composed portfolio of benchmark index funds over the most recently available 3 year period, 10.9 vs. 9.6%, as well as the entire 5 year period, 11.1 vs. 9.6%. (Data annualized thru Sept. 30, 2015; see here to review the data. Note: One, 3, and 5 year data that include the just completed 4th quarter will be published on my website during the 2nd week of Jan.) Based on current valuation and momentum factors, the best that can be said is that the majority of fund categories are what I consider to be HOLDs. There are very few categories that exhibit the characteristics I consider as meriting a BUY designation, along with a few REDUCE/SELLs; for specifics, see the tables below. All categories designated as HOLDs are expected to be worth holding over the next 3 to 5 years, generating decent returns if held over the entire period. Here, then, are my current category recommendations for the nine most recognized U.S. ETF/fund categories starting with those with the most positive longer-term prospects near the top to those with least promising prospects near the bottom: Fund Category Recommendation Large Growth HOLD Mid-Cap Growth HOLD Large Blend HOLD Small Growth HOLD Large Value HOLD Small Value REDUCE/SELL Mid-Cap Value REDUCE/SELL Mid-Cap Blend REDUCE/SELL Small Blend REDUCE/SELL Note that none of the above basic fund categories show up as having particularly strong prospects over the next several years according to my research. While not currently overvalued, each of these categories has run up considerably over nearly the last 7 years, limiting, in my view, their future prospects. International Funds The following table shows my current category recommendations for five international fund categories starting with those with the most positive longer-term prospects near the top down to those with least promising prospects: Fund Category Recommendation Emerging Markets HOLD Japan HOLD Europe HOLD Diversified Pacific/Asia HOLD Diversified International HOLD My research shows that the first 4 out of the 5 international stock fund categories shown above show better prospects than any of the above U.S. fund categories. International stocks have had their problems in recent years, but looking ahead, I believe that prospects, including the economic fundamentals not directly considered in the above recommendations, will improve going forward. Sector Funds While I am not a big advocate of sector funds/ETFs, I present this data for those relatively aggressive investors who might be. Note that because sector funds can be highly volatile and relatively unpredictable, even when considered as longer-term investments, there is an above average risk that any sector forecasts, including mine, will not turn out as expected. Additionally, while you may not choose to invest in sector funds at all, you may find that the non-sector funds you do invest in (or are considering) can have a sizeable proportion of their holdings within one or more sectors. To learn what the sector breakdown is, enter the fund symbol at morningstar.com and look for “Top Sectors.” If the fund overweighs sectors that show up near the lower end in the table below, you may want to factor in this information when considering your ownership of this fund. For example, the PRIMECAP Odyssey Growth Fund (MUTF: POGRX ), a fund highly recommended by Morningstar (see my Dec. Newsletter ), has about 36% of its investments in the Health sector. Since this sector is one that my research does consider highly overvalued and a REDUCE/SELL sector, one might want to be cautious about owning this fund. The following table shows my current recommendations for 14 sector fund categories starting with those with the most positive longer-term prospects at the top to those with least promising prospects near the bottom: Fund Category Recommendation Precious Metals BUY Natural Resources BUY Energy BUY Commodities BUY Technology HOLD Communications HOLD Consumer Defensive (Consumer Staples) HOLD Consumer Cyclical (Consumer Discretionary) HOLD Global Real Estate HOLD Real Estate (U.S.) HOLD Financials HOLD Health REDUCE/SELL Industrials REDUCE/SELL Utilities REDUCE/SELL