The Chilean Economic Miracle Is Over: Is Chile Still A Good Investment?
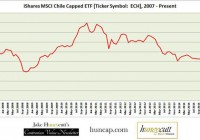
Summary The Chilean stock market has fallen over 50% from its peak due to a weakening copper market. Chile has consistently been ranked as one of the most “economically free” nations in the world. Given the plunging stock market coupled with Chile’s strong economic model, it’s worthwhile to explore for investment. Unfortunately, the political pendulum is swinging back towards the Socialist direction, creating new headwinds for the Chilean economy. Chilean investment could become attractive in the future, but the dual headwinds of a declining copper market and Socialist politics make the risks too high for now. I like seeing a bit of distress in the market. I frequently get asked, “how’s the market doing?”, and I never know how to reply, because for me, I’m typically more excited when it’s doing poorly than when it’s doing well. A down market means there are likely attractive opportunities. A boom market means I have to make some tough decisions on whether to continue to hold some stocks that might not be great values moving forward. I can’t say I’m thrilled about where the S&P 500 is right now. I detailed this issue a bit last year in an article, ” Projecting the Forward Returns on the S&P 500 .” In that article, I concluded that high valuations for US stocks would make it difficult to achieve strong returns moving forward; at least without a significant correction. Certainly, on a micro level, there are still some good deals to be found, but they are not in abundance by any means. Given this, it’s only natural to search outside the US for opportunities. Latin America is an obvious alternative. Smart economic policies in places like Chile, Peru, Colombia, Panama, and Costa Rico have led to improving long-term economic growth over the past few decades. Several Latin American nations have strong capital markets, as well, making it an ideal place to seek out investments. Chile has stuck out to me particularly due to the relatively poor performance of its stock market over the past few years, coupled with high ratings in economic freedom indices. Since its peak in December 2010, the iShares MSCI Chile Capped ETF (NYSEARCA: ECH ) has lost 53% of its value, falling from $80 down to $37. It has now rebounded slightly to about $41. (click to enlarge) Based off of this, Chile seems like an ideal place to seek out investments. However, there are a few issues with this thesis. For this article, I’ll detail the pros and cons of Chilean investment. The Copper Boom and Bust The first question to ask is “why has Chile crashed?” The answer to this question is surprisingly simple: copper. In 2012, copper accounted for 20% of Chile’s GDP and 60% of its exports . Since February 2011, copper prices have fallen about 35%; a substantial decline for such a short period. (click to enlarge) Even now, copper prices are still well-above historical levels. I explored this issue in depth back in December 2011 in my article, ” Copper Producers Could Still Have a Long Way to Fall .” If one adjusts copper prices for inflation using CPI , they will quickly discover that copper still looks somewhat expensive even after the 35% drop of the past few years. The historical average is about $4,600 per Metric Ton, which is currently 28% below the current price level. If we go back further and look at the pre-boom average of $3,440 per Metric Ton, copper would have to fall another 45% to reach that level. (click to enlarge) When a nation’s economy is heavily dependent upon copper and copper prices plunge, then it’s probably to be expected that its stock market would suffer some heavy damages. You can see the correlation between the iShares MSCI Chile ETF , Southern Copper (NYSE: SCCO ), and the S&P 500 (NYSEARCA: SPY ) in the chart below. (click to enlarge) The chart may be a little difficult to read, but the gist of it is that the Chilean ETF and Southern Copper both rebounded quickly and dramatically after the financial crisis, while the S&P 500 lagged behind. From about mid-2011 onwards, it’s been just the opposite with the S&P 500 gaining upward momentum, while ECH and SCCO have suffered significant losses. Economic Freedom Chile is very dependent upon copper and the outlook for copper is more likely to get worse before it gets better. Why might Chile provide attractive opportunities, anyway? One simple response would be that it has one of the best economic models in all of Latin America. The Canadian free market think tank, the Fraser Institute , provides one of the best measures of economic freedom across the globe. There is a significant correlation between national rankings in the Economic Freedom of the World index and long-term real economic growth. In 1970, Chile had a dismal score under 4.0. It remained near the bottom of the world in the Fraser rankings through the early 80’s. At that point, it made several economic reforms which saw it steadily rise in the rankings. As of 2012, it was ranked #10 out of 152 nations surveyed, with a score of 7.84. On the opposite end of the spectrum has been Venezuela. Venezuela was ranked #11 in the world (out of about 65 nations surveyed at the time) with a score of 7.0 in 1970. Since that time, it has steadily dropped until it was ranked dead last (152nd out of 152 nations) in the world in 2012 with a score of 3.89. That put it behind Myanmar, Zimbabwe, and both Congos in the index. (As a side-note, North Korea was not included). (click to enlarge) You can see the radically different paths of Venezuela and Chile in terms of wealth, as well. Measuring in constant US Dollars, Chile’s per capita income has nearly quadrupled over a 53-year timespan, while Venezuela’s has barely budged. (click to enlarge) Source: World Bank, Google Public Data Chile has achieved 2.6% annualized per capita income growth during this time period, while Venezuela has only achieved 0.1% growth. Chile’s annual per capita growth shoots up to 3.8% if we only examine the period from 1982 onwards. Meanwhile, Venezuela’s 0.1% per capita income growth is probably inflated, since it was dependent upon high oil prices, which have now collapsed. Overall, we can see a tale of two completely divergent economies. Chile’s free market economy and strong capital markets provide compelling reasons why a “beaten down” Chile might be a good investment. However, there are caveats. Death and Taxes Unfortunately, the political pendulum might be swinging back in the other direction in Chile. In December 2013, Socialist Michelle Bachelet won a second term as President , winning the election in a landslide. While her first term was largely uneventful, she gained the support the Communist Party in the 2013 Election, and seemed to veer towards more radical left-wing policies. The cornerstone of her second term has been a massive corporate tax hike . Chile’s corporate tax rate was one of the lowest in the world in the last decade, standing at around 15% – 17%. After an increase in 2011, coupled with the new overhaul, the corporate tax will rise to 35% by 2017. Thus, in a matter of 6-7 years, Chile will have gone from having one of the lowest corporate taxes in the world to one of the highest. This is a major headwind facing the Chilean economy and its stock market. Economically, we know it’s likely to lead to significantly lower long-term growth and will lead fewer companies to consider locating within Chile. As a result, there are some legit fears that the “Chilean Economic Miracle” that has run nearly three decades is coming to an end. It’s probably worth noting that this wouldn’t be the first time that a nation with high growth has paralyzed itself with massive taxes. This was exactly the same formula Japan followed to poor results over the past few decades; and not that dissimilar from the US from 1932 – 1946. Much of the European growth of the 60’s and 70’s was also met by a stream of rising taxes in many nations, which led to subdued growth. Even mindlessly ignoring the economic impact of the taxes, it’s obvious that it will have a significant impact on investors. A company making $10 million in pre-tax earnings generated $8.5 million in post-tax earnings under the old system, but only $6.5 million under the new system. That’s about a 24% decline. It’s difficult to think of too many good things about this. It seems unlikely that the tax hike will be reversed any time soon, especially with the copper market suffering. A weaker copper market likely spells weaker government revenues, and this is a government that is intent on increasing spending. That said, a swing back to its Communist past under Salvadore Allende seems unlikely. Rather, what appears more probable is that Chile pushes into quasi-Keynesian territory, following the path of post-asset bubble Japan and the United States in the Great Depression. The pattern thus far under Bachelet’s second term has been to constantly increase spending to “stimulate” the economy and constantly raise taxes to pay for the spending. Chile Versus the US in 1932 One interesting parallel here is the United States in 1932. Under President Herbert Hoover, the US dramatically increased taxes in ’32 leading to even more distress in equities. However, if you invested at the end of 1932 or at the beginning of 1933, you would’ve done pretty well. Nevertheless, the 1930’s market was relatively stagnant and growth stayed weak throughout the entire decade, due to even further tax increases and poor regulatory policies. Chile might be in a similar situation. If stocks get cheap enough, if could be worthwhile to invest there. But I wouldn’t hold my breath on a quick reversal back to the “Economic Miracle” that ran from the mid 80’s through 2011. Chile will likely experience sluggish growth moving forward due to tax and regulatory headwinds that could become even worse after the initial set of reforms fails. Conclusions In spite of the increasingly poor political environment, Chile does have well developed and stable capital markets. It’s true that politics can ruin investments, but it’s also true that well-established institutions put some limits on radical politics. I’m betting at the very least, that there will be some backlash against the recent Socialist policy shifts. However, it could take some time to develop. If Chile were about to benefit from a major cyclical shift, it still might be an attractive target for investment. Unfortunately, poor political policies coupled with headwinds in the copper market likely mean that the 2010’s will be a dismal decade for the Chilean economy and investment. Even in spite of the over 50% decline in the Chilean markets, the iShares Chile ETF still sells at a 20.2x P/E ratio. I wouldn’t necessarily view this as cause for concern, but it’s difficult to imagine corporate earnings significantly rising much with such an unfavorable tax environment moving forward. However, if the market were to continue to decline, it could become attractive at some point even in spite of the major headwinds. Overall, I do think Chile is worth keeping an eye on. There are more attractive places to invest in Latin America for now, though. Disclosure: The author has no positions in any stocks mentioned, and no plans to initiate any positions within the next 72 hours. (More…) The author wrote this article themselves, and it expresses their own opinions. The author is not receiving compensation for it (other than from Seeking Alpha). The author has no business relationship with any company whose stock is mentioned in this article.