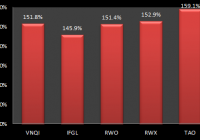
Summary TAO has delivered the strongest total returns, but when it outperformed the pack in the past it usually fell right back within a year. My favorite international equity REIT ETF is VNQI primarily due to the substantially lower expense ratio. While VNQI is offering the best expense ratio here, there are options for international equity without the REIT structure that offer much lower expense ratios. International equity REITs offer investors a compelling opportunity for portfolio diversification, but high expense ratios limit the long term potential returns. To help investors identify which funds might work for them, I’m performing a quick comparison on several of the most liquid options. The ETFs I’m comparing in this piece are: Vanguard Global ex-U.S. Real Estate ETF (NASDAQ: VNQI ) iShares International Developed Real Estate ETF (NASDAQ: IFGL ) SPDR Dow Jones Global Real Estate ETF (NYSEARCA: RWO ) SPDR Dow Jones International Real Estate ETF (NYSEARCA: RWX ) Guggenheim China Real Estate ETF (NYSEARCA: TAO ) Comparing Returns Out of the 5 ETFs, VNQI is by far the youngest. That is a little disappointing because I would love to have a longer period for measuring returns. Since I had to limit my assessment of historical performance to the period in which VNQI was a viable investment, my sample size was reduced to only about three and a half years. The chart below shows the total returns earned for each ETF using dividend adjusted closes since the start of 2012. TAO was the clear winner for the period, but it also shows less correlation with the other ETFs. The weaker correlation should be expected since TAO is investing in China and the other four are showing a great deal of international diversification. In my opinion, TAO is the most dangerous due to the very high volatility of monthly returns (about twice the volatility of the SPDR S&P 500 Trust ETF ( SPY)), but the price charts also indicate that TAO seems to be risky when it deviates from the rest of the pack. The next chart uses those dividend adjusted closes and standardizes for share prices by charting returns over time as a percentage of their starting values. (click to enlarge) The real reason to use a chart like this is to be able to do a quick eyeball check for correlation. When I run correlation statistics, sometimes the values appear to be more correlated than they do when I just eyeball the chart. At a glance we can see that TAO and RWO seem more prone to deviating from the rest of the pack. However, we have also seen that the deviations from the pack are reversed within a year or less. At the moment, TAO is still above the other options and expecting international REIT valuations to stay strongly correlated would suggest it may be moving a little too high unless it is actually breaking out of a very long term connection to the other international REIT markets. Comparing Expense Ratios Remember that over the long term a buy and hold investor will see a meaningful part of their total return determined by the expense ratio. In a period of 3 or 6 months the expense ratio won’t make a large difference in the total returns but a difference of .5% in the expense ratio becomes very meaningful if it is allowed to compound for 30 or 40 years. Even without compounding, a difference of .5% in the expense ratio would devour 20% of the portfolio value over 40 years. The next chart compares the expense ratio for each ETF. Since TAO was the only ETF with a different gross and net expense ratio, I’ve included both in the chart. As you might guess from my feelings about expense ratios, my holding for the exposure is the Vanguard Global ex-U.S. Real Estate ETF. As I’ve been digging into the returns for international equity REITs, I’m finding that I’m less than impressed with the risk to return ratio. Within my portfolio the highest expense ratio comes from VNQI and I’m contemplating if I may want to sell off from the sector all together and just use the Schwab International Equity ETF (NYSEARCA: SCHF ) for my international exposure. I love the REIT structure for investing, but I’d rather see lower levels of volatility and lower expense ratios. The expense ratio on SCHF is only .08%, which thoroughly beats even VNQI. Do I want international equity REIT exposure enough to keep holding VNQI over SCHF? I’m not sure. I want my equity holdings to be long term allocations and if I was going to buy one international equity investment and then not touch it for 40 years, I think I would lean towards SCHF. At the moment, I’m out of my position in SCHF because I liquidated the position to fund a limit-buy order on a microcap. If you’re looking for that international REIT exposure as part of the portfolio, my favorite is VNQI. I’m just starting to question whether it offers enough risk adjusted returns to be worth the allocation I’ve given to it. A Note on RWO RWO holds international REIT investments, but it is really a global REIT ETF. It was holding around 55% of the portfolio in domestic equity REIT investments. The internal diversification is great for an investor that is seeking to get their diversification with as few tickers as possible, but I see no reason to pay .50% on RWO when an investor could pay .24% on VNQI and .12% on the Vanguard REIT Index Fund (NYSEARCA: VNQ ). Conclusion There are a few options for international REIT investing through ETFs. In my opinion, VNQI offers the most compelling option but I’m starting to question whether the sector is worthy of allocation when the expense ratios and level of volatility throughout the industry are so high. If I was holding TAO, I would contemplate selling it whenever it moved meaningfully above the other international equity REIT investments. Since I’m bearish on China and prefer to make long term investments, the strategy doesn’t work very well for me. If I sell out later in the year, I would probably swap to an international ETF with a lower expense ratio. I might also put part of the cash into a short term bond fund to reduce my total exposure to international equity since I am concerned about the correlation between international equity investments. Even if I’m not holding shares in China, if my concerns come to pass I would expect most international ETFs to take a hit even if there was no direct exposure to China. Disclosure: I am/we are long VNQ, VNQI. (More…) I wrote this article myself, and it expresses my own opinions. I am not receiving compensation for it (other than from Seeking Alpha). I have no business relationship with any company whose stock is mentioned in this article. Additional disclosure: Information in this article represents the opinion of the analyst. All statements are represented as opinions, rather than facts, and should not be construed as advice to buy or sell a security. Ratings of “outperform” and “underperform” reflect the analyst’s estimation of a divergence between the market value for a security and the price that would be appropriate given the potential for risks and returns relative to other securities. The analyst does not know your particular objectives for returns or constraints upon investing. All investors are encouraged to do their own research before making any investment decision. Information is regularly obtained from Yahoo Finance, Google Finance, and SEC Database. If Yahoo, Google, or the SEC database contained faulty or old information it could be incorporated into my analysis.