Tag Archives: stocks

Southwest Gas’ (SWX) CEO John Hester Discusses Q2 2015 Results – Earnings Call Transcript

Southwest Gas Corporation (NYSE: SWX ) Q2 2015 Earnings Conference Call August 6, 2015 13:00 ET Executives Ken Kenny – Vice President, Finance and Treasurer John Hester – President and Chief Executive Officer Roy Centrella – Senior Vice President and Chief Financial Officer Justin Brown – Vice President, Regulation and Public Affairs Analysts Matt Tucker – KeyBanc Capital John Hanson – Praesidis Operator Good day, ladies and gentlemen and welcome to the Southwest Gas 2015 Midyear Earnings Conference Call. At this time, all participants are in a listen-only mode. [Operator Instructions] As a reminder, today’s conference is being recorded. I would like to turn today’s conference call to Mr. Ken Kenny, Vice President of Finance and Treasury. You may begin. Ken Kenny Thank you, Kevin. Welcome to Southwest Gas Corporation’s 2015 midyear conference call. As Kevin stated, my name is Ken Kenny and I am Vice President, Finance and Treasurer. Our conference call is being broadcast live over the Internet. For those of you who would like to access the webcast, please visit our website at www.swgas.com and click on the Conference Call link. We have slides on the Internet, which can be accessed to follow our presentation. Today, we have Mr. John P. Hester, Southwest President and Chief Executive Officer; Mr. Roy R. Centrella, Senior Vice President and Chief Financial Officer; and Mr. Justin L. Brown, Vice President, Regulation and Public Affairs and other members of senior management to provide a brief overview of the company’s operations and earnings ended June 30, 2015 and an outlook for the remainder of 2015. Our general practice is not to provide earnings projections. Therefore, no attempt will be made to project earnings for 2015. Rather, the company will address those factors that may impact the company’s year’s earnings. Further, our lawyers have asked me to remind you that some of the information that will be discussed contains forward-looking statements. These statements are based on management’s assumptions, which may or may not come true and you should refer to the language in the press release, Page 2 of our presentation, and also our SEC filings for a description of the factors that may cause actual results to differ from our forward-looking statements. All forward-looking statements are made as of today and we assume no obligation to update any such statements. With that said, I would like to turn the time over to John. John Hester Thanks, Ken. Moving to Slide 3, I would like to summarize some of the highlights of the second quarter. First of all, on the natural gas side of the business, we had 28,000 net new customers in the past year. As we have previously projected, this represents an annualized growth rate of approximately 1.5%. Last month, we commenced construction on our $35 million Paiute Pipeline lateral, which will interconnect with Ruby Pipeline. We expect these facilities to the completed and in service in November of this year. We also submitted a request to the Public Utilities Commission of Nevada for authority to replace $43.5 million of older vintage plastic and steel pipeline next year. All three of these developments are indicative of the positive growth that we are continuing to experience on the regulated utility side of our business. At our unregulated construction services business segment, our effort to fully integrate the Link-Line Group of Companies that we acquired in October of last year continues to progress. We experienced strong revenue growth both organically and from the acquired companies in the past quarter. As we have indicated in previous disclosures over the past year, we continue to believe that we are on pace to reach $950 million to $1 billion in construction services revenues by year end. And with our peak construction season ahead of us, we expect a strong third and fourth quarter that we think will culminate in the construction services group achieving its previously announced 2015 goals. We did increase our loss reserve associated with the Canadian industrial project this quarter by another $2 million and we are currently in negotiations with our customer over change orders. We believe that we are in a very strong position in the ongoing negotiations and that our efforts will result in a substantial mitigation of the current loss reserve. This particular project is essentially complete and we remain very enthusiastic about the construction services segment, including the businesses we acquired this past October. Turning to Slide 4, for today’s call, Roy Centrella will provide an overview on our consolidated earnings as well as separate detail for the regulated natural gas and Centuri Construction Group segments. Justin Brown will provide a recap on the activities that we have been undertaking on the regulatory front and I will wrap up with a report on customer growth, our capital expenditure expectations and an update on our outlook for 2015. With that, I will now turn the call over to Roy. Roy Centrella Thank you, John. As noted, I am going to spend some time reviewing second quarter and 12-month financial results of both the natural gas and construction services segments. I will also highlight some of the key factors impacting the changes between the related periods and potentially influencing full year 2015 results. We will start on Slide 5. Net income for the three months ended June 2015 was $4.9 million, or $0.11 per basic share, down from the $9.6 million, or $0.21 per share earned during last year second quarter. The contribution to net income from both operating segments was down modestly between periods. For the 12-month period ended June, we earned $138 million, or $2.95 per basic share, an improvement from prior period net income of $135 million, or $2.91 per share. Results for the gas segment were markedly better, while the construction segment experienced a slight decline. Let’s turn to second quarter results of the gas segment on Slide 6. A loss of $657,000 was experienced this quarter versus earnings of $1.8 million previously. Operating income declined due mainly to higher operating costs, but was offset by lower interest costs. So other income, which decreased by $2.5 million between periods due mainly to unfavorable returns on company-owned life insurance, or COLI policies, was the primary cause of the decline between periods. Slide 7 provides a breakdown of $4 million operating margin increase, half of which came from customer growth and half from rate relief and other factors. We added 28,000 net customers over the last 12 months consistent with expectations for about 1.5% growth rate. Overall, considering customer growth and rate release, operating margin remains on track to reach our estimated growth forecast of 2% for all of 2015. Moving to Slide 8, you will see that operating expenses increased $5.6 million or 3.5% between quarterly periods. Most of the increase was attributed to higher depreciation and property taxes, resulting from capital expenditures. The reduction in financing cost was attributable to strong cash flows, which allowed us to redeem long-term debt early. I will turn to Slide 9, which summarizes the activity in other income, which declined by $2.5 million between periods. This quarter, we recognized no income on the investments underlying our COLI policies, whereas last year’s earnings amounted to $2.3 million. Next, we will move to Slide 10 and 12-month gas segment results. Net income of nearly $121 million was up about $3.4 million from the $117 million earned in the previous 12-month period. Strong growth in operating margin and flat net operating expenses resulted in a $15 million increase in operating income. A $5.6 million reduction in other income, principally COLI returns, partially offset the improvement in operating income. The next couple of slides further breakdown these components starting with Slide 11 and operating margins. Operating margin grew by $15 million between periods driven by two primary factors. Customer growth contributed $8 million towards the increase, while combined rate relief in California and our Paiute operations kicked in $9 million. Slide 12, total operating expenses. Total operating expenses were flat between periods as increases in depreciation and general taxes were offset by a $14 million decline in O&M expenses. Within O&M, the most significant favorable factors were legal expenses, which fell $5.6 million due to a legal accrual in 2014, which did not recur and a $2 million reduction in rent expense resulting from the company’s purchase of a portion of its headquarters complex, which was previously leased. Slide 13 covers other income and deductions, which declined $11.2 million to $5.6 million. The primary takeaway on this slide is that COLI-related income for the prior period was extremely high due to strong investment returns on assets underlying the policies. On the other hand, in the current period, the $3.4 million return was in the more normal range of $3 million to $5 million. Also, we remind you that in any given period, losses are possible. Next, we will discuss Centuri’s operating results beginning on Slide 14. During the most recent quarter, the construction segment contribution to net income was $5.6 million, down $2.2 million from last year’s $7.8 million. Two factors which influenced this line. First, the loss reserve on the industrial construction project in Canada widened by $2 million. And second, the acquisition of Link-Line made the seasonal aspect of our construction segment more pronounced as it increased a proportionate size of our Northeastern operations and added more fixed cost. This, in no way, dampened our enthusiasm for the business. It’s just a recognition that due to the weather implications, a higher percentage of construction segment earnings are likely to occur during the second half of the year. During the 12-month periods, contribution to net income declined slightly from $17.5 million to $16.9 million. There were several significant factors, which influenced results for both periods, which I will touch on in a minute. Moving to Slide 15, you can see that revenue increased $70 million or 39% between the second quarter of 2014 and 2015. This reflected $32 million of incremental work at NPL and $38 million from the Link-Line acquisition. Construction expenses increased $68 million or 43% between periods with $30 million attributable to NPL and $38 million for the acquired companies. Depreciation expense increased $2.4 million due mainly to equipment purchases to support the higher revenue level, along with $1.4 million of amortizations on acquisition-related intangibles. Now regarding the industrial project, an additional $2 million was incurred beyond our initial reserve estimate to complete the project. The facility is operational and we no longer have employees on-site. We are actively negotiating change orders with the general contractor and believe we will mitigate this loss reserve during the second half of the year. Slide 16 summarizes 12-month construction services results. On the top line, current period revenues totaled $869 million and we are up $207 million between periods with $134 million coming from the acquired companies and $73 million from NPL. Construction expenses increased $189 million with $137 million applicable to the acquired companies and $52 million to the NPL. Depreciation expense increased $9 million, reflecting equipment purchases, Link-Line depreciation of $3.6 million and $4.3 million in amortization of finite live intangibles recognized from the acquisition. The net result of this activity was an increase in operating income of $9.4 million from $28.3 million in the prior periods to $37.7 million in the current 12-month period. Current period operating income reflects a $7.6 million loss reserve on the industrial construction project in Canada as well as $5 million of acquisition costs recorded during the second half of 2014. Prior period operating expenses included $4 million legal settlement recorded in late 2013. As we look ahead to the second half of the year, the construction services segment is well positioned to finish strongly. We are heading into the third quarter construction season peak. There is significant ongoing replacement work in both our U.S. and Canadian service territories. And we are cautiously optimistic that progress will be made on change orders actively being negotiated on the industrial project. I will now turn the time over to Justin Brown for a regulatory update. Justin Brown Thanks Roy. Turning to Slide 17, I would like to focus my comments on the regulatory initiatives that have undergone recent developments since our last earnings call. First, as we have discussed in previous calls, one of our key regulatory initiatives has been to establish infrastructure replacing mechanisms in each of our jurisdictions in order to timely recover capital expenditures associated with projects that enhance the safety, service and reliability to our customers. In Nevada, we recently made our second filing under the recently approved regulations wherein we requested the approval to replace $43.5 million of qualifying projects. These regulations were approved in January 2014 and they authorized Southwest Gas to make annual filings where we will propose the replacement of qualifying projects. We made our first filing in June of last year and subsequently received approval in October 2014 to replace $14.4 million of projects. We anticipate a final commission decision on this year’s application sometime in October. And Nevada regulation, also permit us to make a separate annual filing to implement a surcharge to recover the revenue requirement associated with the previously approved projects. In the fall of 2014, we submitted a rate application and we were authorized to institute a surcharge effective January of this year to collect $2.2 million annually. Similar to last year, we plan to make a proposal on October of this year to update the surcharge to reflect expenditures associated with previously approved projects that have now been completed. In May, the Arizona Corporation Commission approved our requests to update the customer owned yard line or COYL program surcharge to collect annual revenues of $2.5 million, up from the previously approved $1.5 million. The program was approved as part of our last Arizona rate case decision and was most recently expanded in 2014 to include a Phase 2 for the replacement of certain non-Link-Line customer lines. The updated surcharge reflects total capital expenditures of $16 million of which $6.3 million was incurred during 2014 for both Phase 1 and Phase 2. Turning our focus to the two expansion projects, we continue to make progress on the construction of our liquefied natural gas storage facility that was approved by the Arizona Commission. You may recall late last year, we received pre-approval from the Arizona Corporation Commission to construct a $55 million liquefied natural gas storage facility in southern Arizona. We are getting close to completing our due diligence on the land purchase and we recently entered into a contract for the engineering design of the facility. We are looking forward to completing construction of the facility by year end 2017. In Nevada, construction of the Elko County expansion project has officially begun. In June of 2014, our Paiute Pipeline subsidiary made a formal application with the Federal Energy Regulatory Commission requesting approval to build a 35-mile, $35 million lateral to interconnect Paiute with Ruby Pipeline and increase gas supply deliverability to Elko. In May, the FERC issued an order authorizing a certificate of public convenience and necessity to Paiute to construct and operate the project and subsequently provided a formal notice to proceed. Following receipt of the notice to proceed, work began on preparing the 35-mile pipeline corridor for construction. Pipe is also being delivered to the project site and pipeline segments are being welded together and installed. As John mentioned previously, we anticipate construction being completed by year end. Lastly on this slide, you may recall we received approval on California to increase margin by $2.5 million as part of the previously approved annual post test year attrition margin increase of 2.75% per year for calendar years 2015 to 2018. This increase became effective January of 2015. Also consistent with our statements in previous calls, we are still on target for filing an Arizona rate case next year. You may recall, one of the conditions of our last Arizona rate case settlement precludes a filing any sooner than April 30, 2016. Now turning to Slide 18, the purchase gas adjustment or PGA clauses that we have in each of our jurisdictions allow us to adjust rates either monthly or quarterly to timely respond to changing natural gas market conditions and to recover differences between the amount Southwest Gas pays for gas and the cost of gas being recovered from our customers, sometimes resulting in either over or under collections. The benefits of slightly lower and stabilizing natural gas prices combined with having effective PGA clauses in each of our jurisdictions is demonstrated on this slide as we were able to recover approximately $111 million over the first half of this year, moving from an under collected balance at December 31, 2014 to a slightly over collected balance at June 30, 2015. And with that, I will turn it back to John. John Hester Alright. Thanks Justin. Turning to Slide 19, as I mentioned at the outset of our call, Southwest Gas added 28,000 net new customers this past year, continuing the general customer growth trend we have seen across our service territories over the past few years. Moving to Slide 20, indicative data on unemployment rates and employment growth rates in our various service territories are presented in the table shown on this slide. As you can see, unemployment rates in each of our jurisdictions declined year-over-year, reflecting a continuing modest uptrend in general business activity. The trend is less clear, although generally, up in the accompanying employment growth rates displayed. Anecdotal observations seem to confirm a modest continuing upward trend in commerce with major new construction initiatives announced or underway in our major service territories. Moving to Slide 21, we summarized our perspective expectations regarding capital expenditures. We believe that we are on pace to invest $445 million across our service territories by year end. The pie chart on this slide shows a breakout of how those capital dollars will be spent. Looking further into the future, we anticipate that our capital expenditures continue to be in line with our previously disclosed $1.3 billion 3-year capital plan. Turning to our 2015 expectations for the construction services segment on Slide 22, we will continue our ongoing integration efforts to bring the Link-Line Group of Companies into the Centuri Construction Group. We believe we are on track to reach our construction services revenue goal of $950 million to $1 billion by year end. Our operating income for the segment should approximate 6% of revenues depending on the final resolution of our ongoing negotiations related to the Canadian industrial project for which we have recorded a loss reserve. Net interest deductions are expected to be between $7 million and $8 million. Our expectations are before consideration of non-controlling interest and remember that foreign exchange rates and interest rates can impact this segment’s results. Finally, turning to Slide 23 for our outlook for our natural gas utility operations, operating margin is estimated to increase nearly 2% this year. Margin from net new customer growth should be similar to 2014 with the balance of margin growth coming from a variety of rate mechanisms and regulatory decisions. Our operating costs are expected to increase by 3% to 4%. This assumption includes an $8 million pension expense increase to reflect updated actuarial tables. Net interest deductions for this year are expected to be $3 million to $5 million lower than the $68 million recorded in 2014. And finally, as I indicated earlier, our capital expenditures this year should total $445 million. With that, I will turn the call to Ken. Ken Kenny Thanks, John. That concludes our prepared presentation. For those of you who have access to our slides, we have also provided in the appendix with slides that includes other pertinent information about Southwest Gas and can be reviewed at your convenience. Our operator, Kevin, will now explain the process for asking questions. Question-and-Answer Session Operator [Operator Instructions] Our first question comes from Matt Tucker with KeyBanc Capital. Matt Tucker Hey, guys. Thanks for taking my question. First, just wanted to ask at Centuri about the problem project there, could you just give us some sense as to what caused the cost overruns, the nature of the dispute, if you can call it that. Is it more whose it fault or the amount that you are due to recover? And then just kind of what gives you optimism on your position and on the recovery of the cost? Roy Centrella Yes, hi Matt. This is Roy. Well, the project was we talked a little bit about this last time, but it was a relatively short duration project. There is supposed to be 2-month project that crossed over time periods. And when we established the work for this, we are working with the general contractor, there – it was critical that because of that short timeline, the project – the pieces that – the equipment that was needed all come in on a timely basis. And through – really through no fault of our own results, the equipment we needed wasn’t coming in timely and that had, as a result, we had a fair amount of downtime with a good size workforce of about 300 people outside. So, there were – those delays caused revenue – I mean the cost side of the equation to increase. And we finished the project, took probably an extra three days or so to finish and that’s where those extra costs came from. And we initiated negotiations with the general contractor to try to recover those excess cost and that’s where we are today. We believe our position is strong, because we were at the fault of the delay in the equipment coming in. It was a general contractor. And so we are working with them. We would love to settle this without moving to a legal status, but certainly that’s a possibility that we can’t come to the resolution directly. There are legal avenues at what we can pursue. Matt Tucker Thanks. That’s helpful. You kind of preempted part of my next question about kind of the nature of negotiation at this point, but I guess as a follow-up to that, is the general contractor in reasonably good financial condition to your knowledge? Roy Centrella Yes, the best we know. They are a good-sized contractor and have been doing work in the auto industry for a long time. So, we are hopeful that we can make good progress on this leadership. Matt Tucker Got it. Thanks. And then just looking at Centuri’s overall performance in the quarter, if I back out that the project loss, it looks like your operating margin was still about maybe 120 basis points lower year-over-year. If I understand correctly, your view that, that’s primarily attributed to the seasonality in the Link-Line business, is that correct or is there something else that could be going on there? Roy Centrella No, I think that’s the biggest factor. We have some additional fixed cost that come about because of that acquisition, rents and general and administrative costs, things of that nature. And they probably have a bigger summer peak at the Link-Line side of the business than we have at the NPL side. And so as a result of that, we will see more of the earnings shifted to the second part of the year. But right now both sides of the business, the U.S. side and the Canadian side are in their peak operations. Matt Tucker Okay, got it. And then just trying to understand the seasonality a little better, I guess little surprised that the second quarter Link-Line revenues should be lower than the first. Was that unusual, like unusually bad weather this year in the second quarter or is that something you would expect or attributable to something else? Roy Centrella Well, one thing that contract we talked about the industrial project that was all first quarter revenue. And so that’s been – there is no revenues that carried forward from that job into the second quarter. That’s probably the biggest factor. I mean that was $18 million of revenue in the first quarter associated with that job. Matt Tucker Got it. That makes sense. And then just last one, as you are getting further along with the integration of Centuri and getting closer to that $1 billion revenue threshold. You have talked in the past about potentially considering some strategic options for the business when you get there, maybe sometime starting next year? Just wondering if you could update on your current thinking with regard to that? John Hester Hey, Matt, this is John. I think that is our current thinking as we have talked before that we want to make sure that we have the opportunity to continue to grow those businesses and certainly to have a little bit more transparency with the amount of earnings that those businesses will create and I think that they are going to at least need a full calendar year to demonstrate that. And then we will continue to look at our options going forward. We think that certainly, there is a lot of great growth prospects of Centuri. And we think as we talked about a little bit earlier in today’s call that there are a lot of great growth prospects of the utility as well. So, we will continue to try to grow both of those parts of the businesses. And as we continue to go forward, see how the construction services growth rates is going compared to the utility growth rate and continues to look at what options we may have in the future. Matt Tucker Very helpful. Thanks, John. Thanks, Roy. I will back in the queue. John Hester Okay, thank you. Operator Our next question comes from John Hanson with Praesidis. John Hanson Hey, guys. John Hester Hey, John. John Hanson Matt asked most of my questions, but just one kind of follow-up on the construction. What’s your guys view now on more acquisitions in that area? John Hester It’s something that, this is John, John. It’s something that we will continue to look at. One of the things that we have done at Centuri is we have taken a pretty deep dive into what the various business prospects are across the country. We have taken a look at where we have a lot of activity currently being done by the Centuri Group and what kind of markets that we may want to move into. If we see opportunities to move into new markets, we can approach that two ways. We can either start that from the ground up or we can see if there are some smaller tuck-in type companies that may facilitate that growth in markets that we might want to get into. So we will continue to look for those prospects. And if we think it makes sense for our shareholders as an avenue to continue to grow the business profitably we will do that. John Hanson When you talk markets, are you talking more geography or customer type? John Hester Mostly geography, John. John Hanson Good, thank you. Operator [Operator Instructions] And I am not showing any questions at this time. Ken Kenny Okay. Thank you, Kevin. This concludes our conference call and we appreciate your participation and interest in Southwest Gas Corporation. Thank you for being on the call [ph]. Operator Ladies and gentlemen, this does conclude today’s presentation. You may now disconnect and have a wonderful day. Copyright policy: All transcripts on this site are the copyright of Seeking Alpha. However, we view them as an important resource for bloggers and journalists, and are excited to contribute to the democratization of financial information on the Internet. (Until now investors have had to pay thousands of dollars in subscription fees for transcripts.) So our reproduction policy is as follows: You may quote up to 400 words of any transcript on the condition that you attribute the transcript to Seeking Alpha and either link to the original transcript or to www.SeekingAlpha.com. All other use is prohibited. THE INFORMATION CONTAINED HERE IS A TEXTUAL REPRESENTATION OF THE APPLICABLE COMPANY’S CONFERENCE CALL, CONFERENCE PRESENTATION OR OTHER AUDIO PRESENTATION, AND WHILE EFFORTS ARE MADE TO PROVIDE AN ACCURATE TRANSCRIPTION, THERE MAY BE MATERIAL ERRORS, OMISSIONS, OR INACCURACIES IN THE REPORTING OF THE SUBSTANCE OF THE AUDIO PRESENTATIONS. IN NO WAY DOES SEEKING ALPHA ASSUME ANY RESPONSIBILITY FOR ANY INVESTMENT OR OTHER DECISIONS MADE BASED UPON THE INFORMATION PROVIDED ON THIS WEB SITE OR IN ANY TRANSCRIPT. USERS ARE ADVISED TO REVIEW THE APPLICABLE COMPANY’S AUDIO PRESENTATION ITSELF AND THE APPLICABLE COMPANY’S SEC FILINGS BEFORE MAKING ANY INVESTMENT OR OTHER DECISIONS. If you have any additional questions about our online transcripts, please contact us at: transcripts@seekingalpha.com . Thank you!
The Time To Hedge Is Now – August 2015 Update

Summary Brief overview of the series. The most ominous potential trigger events. One new candidate to consider. Current buy prices on my top ten preferred hedge candidates. Discussion of the risks inherent to this strategy versus not being hedged. Back to June 2015 Update Strategy Overview The May highs on the S&P 500 Index have held so far. Will that be it? Hard to say. But there are some potential catalysts to throw the economy and financial markets into disarray. I will explain those in a few moments. Readers regularly offer up possible candidates to me, but somehow there is usually something missing and most do not meet my criteria. One reader (who prefers to remain mysteriously anonymous) offered up a list of companies that he thought should be considered. After taking a hard look at his abundant analysis, I found two that I believe should be considered. I will explain how he selected them and detail my thoughts on one for immediate consideration (I am adding a position myself) later in this article. If you are new to this series, you will likely find it useful to refer back to the original articles, all of which are listed with links in this instablog . In the Part I of this series, I provided an overview of a strategy to protect an equity portfolio from heavy losses in a market crash. In Part II, I provided more explanation of how the strategy works and gave the first two candidate companies to choose from as part of a diversified basket using put option contracts. I also provided an explanation of the candidate selection process and an example of how it can help grow both capital and income over the long term. Part III provided a basic tutorial on options. Part IV explained my process for selecting options and Part V explained why I do not use ETFs for hedging. Parts VI through IX primarily provide additional candidates for use in the strategy. Part X explains my rules that guide my exit strategy. All of the above articles include varying views that I consider to be worthy of contemplation regarding possible triggers that could lead to another sizeable market correction. Part II of the December 2014 update explains how I have rolled my positions. I want to make it very clear that I am NOT predicting a market crash. I just like being more cautious at these lofty levels. Bear markets are a part of investing in equities, plain and simple. I like to take some of the pain out of the downside to make it easier to stick to my investing plan: select superior companies that have sustainable advantages, consistently rising dividends and excellent long-term growth prospects. Then, I like to hold onto to those investments unless the fundamental reasons for which I bought them in the first place changes. Investing long term works. I just want to reduce the occasional pain inflicted by bear markets. If the market (and your portfolio) drops by 50 percent, you will need to double your assets from the new lower level just to get back to even. I prefer to avoid such pain. If the market drops by 50 percent and I only lose 20 percent (but keep collecting my dividends all the while), I only need a gain of 25 percent to get back to even. That is much easier than a double. Trust me, I have done it both ways and losing less puts me way ahead of the crowd when the dust settles. I may need a little lead to keep up because I refrain from taking on as much risk as most investors do, but avoiding huge losses and patience are the two main keys to long-term successful investing. If you are not investing long term, you are trading. And if you are trading, your investing activities, in my humble opinion, are more akin to gambling. I know. That is what I did when I was young. Once I got that urge out of my system, I have done much better. I have fewer huge gains, but had I also have eliminated the big losses. It makes a really big difference in the end. A note specifically to those who still think that I am trying to “time the market” or who believe that I am throwing money away with this strategy. I am perfectly comfortable to keep spending 1.5 percent of my portfolio per year for five years, if that is what it takes. Over that five-year period, I will have paid a total insurance premium of as much as 7.5 percent of my portfolio (approximately 1.5 percent per year average, although my true average is less than one percent). If it takes five years beyond the point at which I began, so be it. The concept of insuring my exposure to risk is not a new concept. If I have to spend 7.5 percent over five years in order to avoid a loss of 30 percent or more, I am perfectly comfortable with that. I view insurance, like hedging, as a necessary evil to avoid significant financial setbacks. From my point of view, those who do not hedge are trying to time the market. They intend to sell when the market turns but always buy the dips. While buying the dips is a sound strategy, it does not work well when the “dip” evolves into a full-blown bear market. At that point the eternal bull finds himself catching the proverbial rain of falling knives as his/her portfolio tanks. Then panic sets in and the typical investor sells after they have already lost 25 percent or more of the value of their portfolio. This is one of the primary reasons why the typical retail investor underperforms the index. He/she is always trying to time the market. I, too, buy quality stocks on the dips, but I hold for the long term and hedge against disaster with my inexpensive hedging strategy. I do not pretend that mine is the only hedging strategy that will work, but offer it up as one way to take some of the worry out of investing. If you do not choose to use my strategy that is fine, but please find a system to protect your holdings that you like and deploy it soon. I hope that this explanation helps clarify the difference between timing the market and a long-term, buy-and-hold position with a hedging strategy appropriately used only at the high end of a near-record bull market. The Most Ominous Potential Trigger Events The Chinese situation is still one of the two potential trigger events that worry me the most. But right now there is one more that concerns me even more. I will get to that in a moment. The Chinese leadership has taken unprecedented steps to “manage” its equities markets. This link to CNN Money outlines the first ten steps taken by China to support the Shanghai and Shenzhen equity markets. Unfortunately, these moves were not enough. The markets did respond to some of the actions by rebounding for one or two days in each case, but then continued to slide. The accompanying video (< four minutes) contains some valuable insights about the challenges faced by Chinese authorities in the coming months. The most recent move by China was to infuse its China Securities Finance corporation, a government agency that invests in whatever the government need to prop up and often referred to as the CSF, with additional buying power of nearly $1 trillion (including potential leverage) to buy equities. That has kept shares from falling further, but has not changed perception yet. So Chinese stocks remain more than 30 percent off highs set in June this year. There are still over a thousand company stocks on which trading has been halted. What is going through the minds of the investors who own those shares? For now, they are not losing money. But when the stocks begin trading again, having been halted well above current levels, there is a very good chance those shares will take a tumble. Another aspect is that, as an investor in equities, we often take comfort in knowing that at any time we can access our money by selling our shares in a liquid market. But when one is no longer able to sell shares, one cannot access the money. It is very similar to having money in a bank (think Greece) and not be able to make withdrawals. That makes investors nervous and can have a lasting effect on their respective perspectives. That could boil over into how investors begin to think about other investments. It is a good life lesson to learn, but have the Chinese investors learned from it? Only time will tell. I can't write too much about China here or this article will become too long, so I will just include a few more links here that should help you understand the situation better: Why The China Stock Crash Matters The dark side of China's heavy-handed response to its plunging stock markets China's stock market crash is a problem for the whole world Giant Hedge Fund Bridgewater Flips View on China: 'No Safe Places to Invest' The point of all this is that if China cannot prop up equities now while the real estate market is still soft, the potential negative psychological impact on Chinese investors could spill over into other areas of the economy, not just stocks. Only about 15 percent of household savings in China is invested in stocks, so if this can be managed, the overall impact could be contained. But if it cannot be managed and stocks fall further, the fear could spill over into real estate where about 70 percent of household wealth is invested. Then, the problem becomes panic and fear and leadership loses control. The result could be that the engine driving world economic growth crashes and where does that leave the rest of us? Now for the second, and more imminent problem we face, as if China is not big enough. The energy sector, especially oil prices, has not found a bottom yet. I recently wrote a three-article series which explains this in greater detail. But to summarize, as oil prices continue to fall due to oversupply while we near the end of driving season in the northern hemisphere and peak annual demand, more and more oil-producing companies in the U.S. are going to be required to write down assets (reserves) and will continue to lose money each quarter at least through year end. This will trigger loan covenants that will force companies into bankruptcies (the process is also explained in more detail in Part III of the series linked above). That, in turn, will raise red flags for holders of other junk bonds as interest rates rise due to the increase in bankruptcies. And it gets worse because many junk-rated bonds in emerging markets are denominated in U.S. dollars and will get hit hard similar to what we saw when our Fed decided to exit its QE strategy. The result before, even without a crash in junk bonds was a global economic slowdown due to stricter borrowing requirements. That led to significant equity devaluation in many emerging market exchanges. I believe it will again this time. And the junk bond market today is much larger than the $800 billion problem we faced with Lehman Brothers. Now, it may be that our Fed and political leaders decide to put us all further into debt in order to save us once again, but that will merely prolong the inevitable, in my opinion. The fact is I do not believe that the political will is there to step up big enough to contain this one. Again, I could be wrong in how I have assessed this risk, but it is certainly a major concern and we should tread cautiously until early next year when I believe the worst (relating to the energy sector) will be behind us. The current bull is now longer in duration than all is getting very long in the tooth. So, I am preparing for the inevitable next bear market. I do not know when the strategy will pay off, and I will be the first to admit that I am probably earlier than I suggested at the beginning of this series. However, I do feel confident that the probability of experiencing another major bear market will rise in the coming year(s). It may be 2015, 2016 or even 2017, before we take another hit like we did in 2000-2002 or 2008-09. But I am not willing to risk watching as much as 50 percent of my portfolio evaporate to save the average of about one percent per year cost of a rolling insurance hedge. I am convinced that the longer the duration of the bull market lasts, the worse the resulting bear market will be. I continue to base my expected hedge position returns on a market swoon of 30 percent, but now believe that the slide could be much worse as this bull continues to outlive its ancestry. You may disagree with my assessment of the potential severity of the next recession and the impact it will wreak on equities; none of us knows with certainty what the outcome will be or when it will happen. It is very conceivable that we could experience a mild correction, followed by a strong bounce, before the really big bad bear shows itself. But there is one thing we all do know: eventually it will come. I will be prepared. Will you? New Candidate to Consider I want to introduce the Men's Wearhouse (NYSE: MW ) as a new candidate. It has all the attributes of a potential big loser in the next recession: a beta of 1.66, it is losing money because of a recent large merger and has taken on a lot of debt, and it fell faster and further (80 percent) than the overall market in 2008-09. The company operates in the retail clothing industry, where sales generally drop dramatically when people lose or worry about losing jobs. A men's suit purchase can often be put off for a year or two for most middle-class households. And, based upon the additional analysis by my new friend, the stock fell 30 percent in 2011 when the broad market fell 19.4 percent, and it fell about 24 percent in 2014 when the broader market was down only 7.4 percent. I like those odds. Might I also point out that learning from one another and trading ideas and analysis is one of the great benefits of Seeking Alpha. I may not have identified this candidate without help from a complete stranger a thousand miles away. I will include the specifics on MW below in the list my top of candidates. Current Premiums on Select Candidates In this section, I will provide current quotes and other data points on selected candidates that pose an improved entry point from the last update. All option quotes are based upon the close on Monday, August 4, 2015. The stock quotes are all from during the market after lunch on Tuesday. I am writing the finishing touches on this article on Tuesday, but since the market and all but one of my candidates' stock prices are up, I decided not to take the several hours it takes to update the selection process of my put candidates. You should be able to get better entry points than those listed below. I am calculating the possible gain percentage, total estimated dollar amount of hedge protection (Tot Est. $ Hedge) and the percent cost of portfolio using the "ask" premium. You should be able to do better than the listed premium unless the share price of the listed stock has fallen significantly between Monday (only MAR is down) and the time you read this article. I suggest that, if you decide to buy puts to employ this strategy, you should place limit orders only at about the midpoint between the most recent bid and ask prices listed. You may need to adjust your bid slightly higher if you do not get a fill, but a few pennies does not ruin the return potential on the listed option contracts. I try to buy on days when the market is either making new highs or nearing those levels and on a day when the market in general is heading higher. Please remember that all calculations of the percent cost of portfolio are based upon a $100,000 equity portfolio. If you have an equity portfolio of $400,000, you will need to increase the number of contracts by a factor of four to gain adequate coverage. Also, the hedge amount provided is predicated upon a 30 percent drop in equities during an economic recession and owning eight hedge positions that provide protection that approximates $30,000 for each $100,000 of equities. So, you should pick eight candidates from the list and make sure that the hedge amounts total to about $30,000 (for each $100,000 value in your stock portfolio). Since each option represents 100 shares of the underlying stock, we cannot be extremely precise, but we can get very close. If the market drops by more than 30 percent, I expect that to do better than merely protect my portfolio because these stocks are very likely to fall further and faster than the overall market, especially in a crash. Another precaution: do not try to use this hedge strategy for the fixed income portion of your portfolio. If the total value of your portfolio is $400,000, but $100,000 of that is in bonds or preferred stocks, use this strategy to hedge against the remaining $300,000 of stocks held in the portfolio (assuming that stock is all that is left). This is also not meant to hedge against other assets such as real estate, collectibles or precious metals. Finally, the companies are not listed in the order of my preference, but represent my favorite ten at this time. If you want a more detailed explanation of why I expect these particular stocks to fall more than the broad market, please refer to the earlier articles in this series which can be found at this link . To keep the overall length of this article down, I will dispense with my reasoning for each candidate as that can be found detailed at the link. If you disagree with my expectations for any of the stocks listed, please feel free to mix and match or use some others with which you feel more comfortable. Just make sure that the stocks you use are likely to be ravaged more by a recession than the average company. Goodyear Tire & Rubber (NASDAQ: GT ) Current Price Target Price Strike Price Bid Premium Ask Premium Poss. % Gain Tot Est. $ Hedge % Cost of Portfolio $31.04 $8.00 $22.00 $0.20 $0.30 4,567 $4,110 0.09% I would need three January 2016 GT put option contracts to cover approximately one-eighth of a $100,000 equity portfolio. If you already own a full position of GT options, do not exchange those for the new position. This would only add to your cost by increasing transactions. This new position is for anyone who has not yet completed their position or who may be rolling over to replace a July position. This statement applies to all of the "new" positions listed in this article. Do not trade in and out of positions to try to improve your overall position. That just defeats the purpose of keeping this strategy affordable. A better strategy is to average into a position over time, lowering your average cost basis with each purchase. Williams-Sonoma (NYSE: WSM ) Current Price Target Price Strike Price Bid Premium Ask Premium Poss. % Gain Tot Est. $ Hedge % Cost of Portfolio $85.96 $24.00 $72.50 $1.55 $1.80 2,594 $4,670 0.180% I need only one January 2016 WSM put option contract to provide the indicated loss coverage for each $100,000 in portfolio value. Tempur Sealy International (NYSE: TPX ) Current Price Target Price Strike Price Bid Premium Ask Premium Poss. % Gain Tot Est. $ Hedge % Cost of Portfolio $76.54 $16.00 $60.00 $1.05 $1.50 2,567 $3,850 0.150% I will need only one January 2016 TPX put options to complete this position for each $100,000 in portfolio value. Royal Caribbean Cruises (NYSE: RCL ) Current Price Target Price Strike Price Bid Premium Ask Premium Poss. % Gain Tot Est. $ Hedge % Cost of Portfolio $90.01 $22.00 $72.50 $1.57 $1.65 2,961 $4,885 0.165% I need one January 2016 RCL put option contract to provide the indicated loss coverage for each $100,000 in portfolio value. Men's Wearhouse Current Price Target Price Strike Price Bid Premium Ask Premium Poss. % Gain Tot Est. $ Hedge % Cost of Portfolio $58.49 $25.00 $45.00 $0.55 $0.75 2,567 $3,850 0.150% I need two January 2016 MW put options to provide the indicated loss coverage for each $100,000 in portfolio value. Marriott International (NASDAQ: MAR ) Current Price Target Price Strike Price Bid Premium Ask Premium Poss. % Gain Tot Est. $ Hedge % Cost of Portfolio $70.80 $30.00 $62.50 $1.30 $1.45 2,141 $3,105 0.145% I need one January 2016 MAR put option contract to provide the indicated loss coverage for each $100,000 in portfolio value. E*TRADE Financial (NASDAQ: ETFC ) Current Price Target Price Strike Price Bid Premium Ask Premium Poss. % Gain Tot Est. $ Hedge % Cost of Portfolio $29.28 $7.00 $22.00 $0.32 $0.43 3,388 $4,371 0.129% The position shown above would require three January 2016 ETFC put option contracts to provide the indicated loss coverage for each $100,000 in portfolio value. Morgan Stanley (NYSE: MS ) Current Price Target Price Strike Price Bid Premium Ask Premium Poss. % Gain Tot Est. $ Hedge % Cost of Portfolio $38.98 $15.00 $35.00 $0.91 $0.96 1,983 $3,808 0.192% I need two January 2016 MS put contracts to provide the indicated loss coverage for each $100,000 in portfolio value. L Brands (NYSE: LB ) Current Price Target Price Strike Price Bid Premium Ask Premium Poss. % Gain Tot Est. $ Hedge % Cost of Portfolio $84.49 $24.00 $70.50 $1.40 $1.50 2,600 $3,900 0.150% I need one January 2016 LB put contract to provide the indicated loss coverage for each $100,000 in portfolio value. Sotheby's (NYSE: BID ) Current Price Target Price Strike Price Bid Premium Ask Premium Poss. % Gain Tot Est. $ Hedge % Cost of Portfolio $41.95 $16.00 $31.00 $0.25 $0.55 2,627 $4,335 0.165% I need three January 2016 BID put contracts to provide the indicated loss coverage for each $100,000 in portfolio value. Summary My top eight choices at this time, in the order of my preference, are LB, MAR, WSM, RCL, MS, GT, ETFC, TPX, BID and MW. Using the first eight, the group (using the put option contracts suggested above) should provide approximately $32,699 in downside protection against a 30 percent market correction at a cost of 1.2 percent of a $100,000 portfolio. Overall, my average cost to hedge this year is less than to 1.5 percent of my equity portfolio. If you want to employ this strategy but do not like using one or more of these eight candidates for a hedge position, please feel free to choose from the other eight or pick some of your own. Brief Discussion of Risks If an investor decides to employ this hedge strategy, each individual needs to do some additional due diligence to identify which candidates they wish to use and which contracts are best suited for their respective risk tolerance. I do not always choose the option contract with the highest possible gain or the lowest cost. I should also point out that in many cases I will own several different contracts with different strikes on one company. I do so because as the strike rises, the hedge kicks in sooner, but I buy a mix to keep the overall cost down. My goal is to commit approximately two percent (but up to three percent, if necessary) of my portfolio value to this hedge per year. If we need to roll positions before expiration there will be additional costs involved, so I try to hold down costs for each round that is necessary. I do not expect to need to roll positions more than once, if that, before we see the benefit of this strategy work. I want to discuss risks for a moment now. Obviously, if the market continues higher beyond January 2016, all of our new option contracts could expire worthless. I have never found insurance offered for free. We could lose all of our initial premiums paid plus commissions. If I expected that to happen, I would not be using the strategy myself. But it is one of the potential outcomes and readers should be aware of it. And if that happens, I will initiate another round of put options for expiration beyond January 2016, using from up to three percent of my portfolio to hedge for another year. The longer the bull maintains control of the market, the more the insurance will cost me. But I will not be worrying about the next crash. Peace of mind has a cost. I just like to keep it as low as possible. Because of the uncertainty in terms of how much longer this bull market can be sustained and the potential risk versus reward potential of hedging versus not hedging, it is my preference to risk a small percentage of my principal (perhaps as much as three percent per year) to insure against losing a much larger portion of my capital (30 to 50 percent). But this is a decision that each investor needs to make for themselves. I do not commit more than five percent of my portfolio value to an initial hedge strategy position and have never committed more than ten percent to such a strategy in total before a major market downturn has occurred. The ten percent rule may come into play when a bull market continues much longer than expected (like three years instead of 18 months). And when the bull continues for longer than is supported by the fundamentals, the bear that follows is usually deeper than it otherwise would have been. In other words, I expect a much less powerful bear market if one begins early in 2015; but if the bull can sustain itself into late 2015 or beyond, I would expect the next bear market to be more like the last two. If I am right, protecting a portfolio becomes ever more important as the bull market continues. As always, I welcome comments and will try to address any concerns or questions either in the comments section or in a future article as soon as I can. The great thing about Seeking Alpha is that we can agree to disagree and, through respectful discussion, learn from each other's experience and knowledge. Disclosure: I/we have no positions in any stocks mentioned, and no plans to initiate any positions within the next 72 hours. (More...) I wrote this article myself, and it expresses my own opinions. I am not receiving compensation for it (other than from Seeking Alpha). I have no business relationship with any company whose stock is mentioned in this article. Additional disclosure: I own put option positions in all the stocks listed as part of my personal portfolio hedge strategy.

How To Catch A Falling Knife

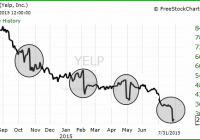
Summary The “falling knife” stock is increasingly common. The current economic environment increases risk in falling stocks. One long-established investment technique can minimize the risk. Falling knife: A security or industry in which the current price or value has dropped significantly in a short period of time. A falling knife security can rebound, or it can lose all of its value, such as in the case of company bankruptcy where equity shares become worthless. –Investopedia Remember Boston Chicken? Inspired by the heady days of the late ’90s and my personal effort to improve their top line, I watched BOST decline in price and finally made a major share purchase when it was so low I could not resist. To this day I maintain that no company can go broke trying to sell too much fat, salt, and sugar to the American public. This axiom was overcome by BOST’s incestuous finances and the practice of selling one dollar of chicken for 95 cents, which led to bankruptcy in 1998. A $50 check from the subsequent class action lawsuit did little to assuage my five figure loss. There were many lessons to be had from this experience. The one I want to concentrate on is the value of dollar cost averaging, or DCA, in purchasing stocks that are declining in price. DCA refers to planned purchases in multiple increments over time, in contrast to a one time purchase of the full investment. If I had used DCA with Boston Chicken, my loss would have been much less severe. DCA is useful in many circumstances, but its benefits are magnified in cases where a stock is in a significant decline. The Falling Knife Scenario The classic falling knife scenario consists of an abrupt price change. Yelp is a particularly hair-raising example: A broader definition of “falling knife” is any stock that is in a clear price decline over a period of time. Under this definition there are many falling knives among today’s investment choices. Every day articles appear on Seeking Alpha enthusiastically recommending a purchase because stock X is N per cent off its high. Readers will often note that such articles have appeared since a decline began. Here are three companies in the falling knife category that have had bullish articles all the way down: American Capital Agency (NASDAQ: AGNC ), Emerson Electric (NYSE: EMR ), Chevron (NYSE: CVX ): How long and how severe these declines will be no one knows. At losses from 52 week highs of 22%, 19%, and 30% for EMR, AGNC and CVX there could still be a lot of air underneath them. Other widely held falling knives include: Exxon Mobil (NYSE: XOM ). Intel (NASDAQ: INTC ), Caterpillar (NYSE: CAT ), Freeport-McMoRan (NYSE: FCX ), BHP Billiton (NYSE: BBL ) (NYSE: BHP ), National Oilwell Varco (NYSE: NOV ), and 3M (NYSE: MMM ). The DCA Effect Using Chevron as an example the usefulness of DCA is clear. An investment of $30,000 when CVX had declined 10% from its high of $130 would buy 256 shares: Date Price Investment Shares 10/02/2015 $117 $30,000 256 Value 08/01/15 $88 $22,528 256 An investment in three increments over equal time periods would buy 293 shares: Date Price Investment Shares 10/02/2015 $117 $10,000 85 03/01/2015 $105 $10,000 95 08/01/20015 $88 $10,000 113 Value 08/01/15 $88 $25,784 293 The DCA approach buys 37 more shares, $3,256 more in value, and $159 more in annual income. If CVX returns to $130, the price at which it started, the difference in total value rises to $4,810. It is true that there is a possibility of losing out on some gains if a stock rises in value between purchases. But as Daniel Kahneman wrote in classic book Thinking, Fast and Slow : Losses loom larger than gains. The “loss aversion ratio” has been estimated in several experiments and is usually in the range of 1.5 to 2.5. For the average investor, the good feelings you get from gains are more than wiped out by the bad feelings from losses. Perhaps humans have an instinctual aversion to loss of capital. Why is DCA important now? DCA has strengths that apply to all circumstances, such as reducing risk and replacing emotion with discipline. In today’s markets its benefits are particularly important. After six years of almost uninterrupted rise in stock prices, recency bias is very strong. Recency bias causes investors to believe trends and patterns have observed in the recent past will continue in the future. Investors look at where a stock has been, not where it is going. Complacency among investors is high. New investors have with no experience of a declining market have an inflated sense of their stock-picking ability. Older investors, with six years of mostly positive experience, may think that their prowess has improved more than it has. Price declines reflect changes in the macroeconomic situation. Global growth estimates continue to be lowered. Money is no longer being added to the US system through quantitative easing, and as shown by Eric Parnell and others there has been a strong relationship between QE and stock market performance. In addition, numerous indicators have been flashing warning signs for some time. DCA is agnostic concerning market projections but economic changes do affect results. Conclusions The falling knife conundrum — what to do when a stock we like is falling — is increasingly common. The angel on one shoulder tells us to buy and the angel on the other shoulder tells us not to lose money. Dollar cost averaging is a way to resolve these different impulses. DCA is helpful in many situations, but particularly today when uncertainty is increasing and six years of successful stock-picking may have inflated both our confidence in the market and the perception of our abilities. DCA takes away the pressure of having to make a one-time purchase decision, allows us to act independently of market noise, and reduces risk. Disclosure: I/we have no positions in any stocks mentioned, but may initiate a long position in XOM EMR over the next 72 hours. (More…) I wrote this article myself, and it expresses my own opinions. I am not receiving compensation for it (other than from Seeking Alpha). I have no business relationship with any company whose stock is mentioned in this article.