Tag Archives: stocks

U.S. Treasury ETFs Rise On Yuan Devaluation

The global investing world across asset classes was caught off guard on August 11 as Chinese policymakers devalued the country’s currency by 2% against the greenback to boost its waning export profile. The step resulted in the largest single-day decline since the historical devaluation in 1994 , after China arranged its official and market rates in a line. As a result, yuan has now plunged to a four-year low level. The Chinese central bank defended its currency intervention ‘as a free-market reform’, but global experts apprehend a currency war in the near future, especially among the Asian tigers. Most export-centric economies are likely to resort to currency devaluation to rev up their exports. However, yuan devaluation took the global markets in its grip as most asset classes were in red. In fact, the move was criticized by U.S. lawmakers and viewed as means of taking undue favor in exports. Bloodbath in global equities, commodities and currencies spurred a flight to safety for a valid reason. Several ETFs on safe haven assets including greenback-based PowerShares DB US Dollar Index Bullish Fund (NYSEARCA: UUP ) and gold bullion-based SPDR Gold Shares (NYSEARCA: GLD ) added gains on August 11. UUP gained 1.5% after hours and GLD added 0.5% in the key trading session. Here investors should note that the UUP’s strength came mainly on the back of Yuan devaluation and the looming Fed rate hike concern; a safe haven criterion played a lesser role for its ascent. On the other hand, though gold advanced for a day, we are skeptical about its momentum as the metal is due for a southward ride (presumably) in the near term due to a number of issues. In fact, this yuan devaluation will likely curb the import demand of gold from China (a key gold consuming nation) as a feebler currency will turn imports pricier. U.S. Treasury: True Safe-Haven In such a backdrop, investors started to position themselves for the imminent volatility in the risky assets and started to park their money in the safer U.S. treasuries, despite the Fed rate hike worries. Most U.S. treasury ETFs, specially the long-dated ones, added considerable gains on August 11. Yields on the U.S. benchmark 10-year notes, slipped to 2.15% on August 11 from 2.24% the day before. Below we have highlighted four Treasury ETFs that have hogged investors’ attention lately and added gains despite the looming rate hike concerns. Vanguard Extended Duration Treasury ETF (NYSEARCA: EDV ) This fund provides exposure to the long-term Treasury STRIPS market by tracking the Barclays U.S. Treasury STRIPS 20-30 Year Equal Par Bond Index. The fund holds 71 bonds in total with effective maturity of 25.2 years and average duration of 24.8 years. Expense ratio comes in at 0.12%. The product has amassed $379.2 million in its asset base. Its gains came in at 2.14% in the yesterday’s session (on August 11). Pimco 7-15 Year U.S. Treasury Index Fund (NYSEARCA: TENZ ) The fund looks to track the returns of the BofA Merrill Lynch 7-15 Year US Treasury Index. The index is unmanaged and tracks the performance of the direct Sovereign debt of the U.S. Government with at least $1 billion in outstanding face value and a remaining term to final maturity of at least 7 years and less than 15 years. The fund has amassed over $24 million in assets so far and charges 15 bps in fees. The fund holds 15 bonds in total with effective maturity of 9.03 years and average duration of 7.89 years. TENZ was up over 2.8% in the last session. iShares 20+ Year Treasury Bond ETF (NYSEARCA: TLT ) The ultra-popular long-term Treasury ETF – TLT – tracks the Barclays Capital U.S. 20+ Year Treasury Bond Index and has AUM of $4.92 billion. Expense ratio comes in at 0.15%. Holding 29 securities in its basket, the fund focuses on the top credit rating bonds with average maturity of 26.82 years and effective duration of 17.35 years. The fund was up 1.6% on August 11. SPDR Barclays Capital Long Term Treasury ETF (NYSEARCA: TLO ) The fund considers U.S. treasuries that have a remaining maturity of 10 or more years. The $201 million-fund holds 45 securities with average maturity of 24.98 years and effective duration of 17.23 years. The fund charges 10 bps in fess and was up about 1.5% on August 11. Bottom Line Having said this, we would like to note that the bond market is in a volatile mood. Especially the U.S. fixed income space is in a tug of war between safe haven demand and the imminent Fed rate hike. Though U.S. benchmark yields fell lately, any hint at Fed policy normalization will once again push up interest rates. So, edgy investors need to be hawk-eyed before playing the safe-haven fixed-income securities in this choppy market. Original Post
Is More Information Making Us Worse Investors?

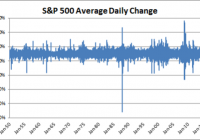
Study after study has shown that retail investors and professional money managers just aren’t very good at investing. And the primary cause of this poor performance is being overly active and incurring lots of unnecessary taxes and fees. The pros can’t control themselves because they have to impress their clients by trying to look active and “beat the market.” And the retail investor is prone to be short term because they know their financial lives are a series of short-term financial events in a long-term life. But an interesting thing appears to be occurring over the course of the last 65 years. Despite a preponderance of information and market access, we seem to be getting no better at investing AND the markets seem to be getting more volatile. If we look at the average daily change in the S&P 500, we can see a slight shift in the variance of the data over time: That’s not very clear, though. If we rearrange that chart, we can construct the average annualized standard deviation of the daily returns: This chart clearly shows that stock market volatility has increased over the last 65 years. There is almost certainly a multitude of causes here, but I don’t think it’s a coincidence that the 1980s and the era of new technology and market access has coincided with the explosion in higher volatility since then. This makes me wonder about two things: What does this say about information theory, economic theory and financial theory? What does this tell us about the current era of investing? What does this say about information theory, economic theory and financial theory? One would think that more information would make the markets behave more “efficiently.” And while we know that professional investors don’t beat the market consistently, we also know that the average holding time on stocks has cratered over the last 70 years, which means that investors, in the aggregate, are paying more in taxes and fees than they previously did. In fact, the average holding period is now consistent with a short-term capital gains rate which means the business of active investing has become a lucrative business for Uncle Sam! This means, by definition, that the post-fee and post-tax return on the aggregate of publicly-held stocks has to be lower than it was in 1940. This would seem to imply that easier access to markets and information has actually made us worse at investing. More information isn’t making us more rational or more efficient. It’s fueling our behavioral biases and short-term tendencies. Access to trading accounts combined with the 24-hour news cycle has become a behavioral nightmare for investors. And yet the vast majority of investors think that all of this information is making them smarter when the data shows that they’re not nearly as financially competent as they think. Contributing to this is all the new technologies. This includes discount brokerage firms, high-frequency trading, leveraged index funds, robo advisors, free trading applications, etc. All of these businesses feed off of our “get rich quick” mentality and/or give us access to markets in an unprecedented manner which fuels our behavioral biases in any number of ways. Further, investors haven’t been compensated for this added volatility. The average 3-year return on the S&P 500 is only marginally higher in the last 25 years than it is over the last 65 years. This shows how futile the idea of “risk” as “standard deviation” really is. In other words, the textbook model of the financial markets hasn’t at all reflected what one might have expected where more information makes markets more efficient, and more volatility compensates investors for what is considered more risk. Basically, modern financial theory doesn’t tell us much about modern financial reality. What Does This Tell us About the Modern Era of Investing? Nothing good. I’ve talked about the difficulty of managing time in one’s portfolio . This intertemporal conundrum is, by a wide margin, the most difficult concept to master in portfolio management. This is the problem of time in an investor’s portfolio. While we know we should be long term, we are inclined to be short term for any number of reasons. Threading that needle and finding the timeframe that makes the most sense for you is incredibly difficult. I’d venture to guess that investors in the 40s probably weren’t far off with their 7-year period. Sadly, what I seem to be finding is that more and more investors are veering in the direction of being ultra short term, hoping to make the quick risk-free buck. And in doing so, they’re falling victim to all of the behavioral biases that are driving this extremely short-term view which necessarily leads to poor performance.

Emerging Market ETFs Slip To 52-Week Lows

Emerging markets have been out of investors’ favor over the past several months piling up heavy losses. Notably, the MSCI Emerging Markets Index plunged 20% since its peak last September, indicating that it has entered into a bear territory and will drop further. This is mainly due to slow economic growth, China turmoil, low commodity prices, falling exports, sluggish currencies, strong dollar, rising Treasury yields, and a looming interest rate hike. The worries deepened in recent weeks following solid July jobs data that raised the chances of the Fed pulling its trigger on the first rate hike in almost a decade, as early as next month. The end of a cheap and an abundant dollar era would pull out more capital from these markets, stirring up trouble for most emerging nations. Further, China’s surprise decision to devalue the yuan in order to boost its export competitiveness has triggered the broad sell-off in the emerging markets this week. This is because devaluation of the yuan means cheaper Chinese exports, lower prices for commodities and lower stock prices (read: ETFs to Move on Yuan Devaluation ). The bearish trend is expected to persist in the months ahead given that the emerging markets will continue to struggle from twin attacks of an interest rate hike and lower commodity prices. As a result, the World Bank lowered its 2015 growth forecast for these nations to 4.4% from 4.8%, and the International Monetary Fund cut its growth outlook to 4.2% from 4.6%. Moreover, recent economic data suggests that growth in emerging markets stagnated in July and employment fell for the fifth successive month. This is especially true as Markit Emerging Market PMI number of 50.2 for July remained close to 49.6 recorded in June, suggesting that emerging markets are growing at a meager 4% annually. This growth rate has been the weakest since 2002 excluding the 2008-09 global financial crisis and the 2013 “taper tantrum”. In this tough environment, emerging markets stocks and ETFs have been on a wild ride over the past several months. While most of the products have seen terrible trading, we have highlighted four ETFs that slipped to 52-week lows in the last session and could see steeper falls in the days ahead. All these funds currently have a Zacks ETF Rank of 3 or “Hold” rating. SPDR S&P Emerging Markets Dividend ETF (NYSEARCA: EDIV ) This fund provides exposure to the stocks from emerging market countries that offer high dividend yields by tracking the S&P Emerging Markets Dividend Opportunities Index. It has accumulated $370.6 million in its assets base and trades in an average daily volume of roughly 68,000 shares. Expense ratio came in at 0.49%. In total, the fund holds 121 stocks in its basket with none holding more than 3.39% of total assets. The product is slightly skewed towards financials at 26.9%, followed by telecom services and information technology with 18.1% share each. Taiwan accounts for one-fourth of the portfolio while South Africa and Brazil round off the next two countries with double-digit allocation each. The ETF dropped to a 52-week low of $28.45 per share, plunging 18.7% over the past three months. PowerShares FTSE RAFI Emerging Markets Portfolio ETF (NYSEARCA: PXH ) This ETF follows the FTSE RAFI Emerging Markets Index, a benchmark that seeks to track the performance of the largest emerging market equities on four fundamental measures – book value, cash flow, sales and dividends. Holding 338 securities in its basket, the fund allocates no more than 3.5% in a single security. Financials (32.1%) and energy (23.2%) take the top two spots while other sectors make up for a single-digit allocation in the basket (read: Can Emerging Market ETFs Defy U.S. Rates Hike? ). In terms of country holdings, about one-fourth of the portfolio goes to Chinese firms while Brazil, Taiwan and Russia round off the next three spots with double-digit exposure each. The fund has amassed $387.8 million in its asset base, and trades in a good volume of around 220,000 shares a day. It charges 49 bps in annual fees from investors. PXH lost 16.7% over the past three months and touched a new 52-week low of $16.63 per share. iShares MSCI Emerging Markets ETF (NYSEARCA: EEM ) It is the most popular and widely traded emerging market ETF with an AUM of $24.2 billion and average daily volume of more than 47.6 million shares. The fund tracks the MSCI Emerging Markets Index and charges 68 bps in annual fees from investors. Holding 846 securities, the product is widely spread out across various components with each holding less than 3% of assets. However, the product is tilted towards the financial sector at 29.4%, followed by information technology (17%). Among the emerging countries, China takes the top spot at 23.9% while South Korea and Taiwan round off the next two spots with double-digit exposure each. The fund slid to a 52-week low of $35.78 per share, representing a loss of about 13% over the past three months (read: ETFs to Lose or Gain from Solid July Job Data ). Vanguard FTSE Emerging Markets ETF (NYSEARCA: VWO ) This fund tracks the FTSE Emerging Index and holds 1,022 securities in its basket. Like the other counterparts, this ETF is also spread out across various securities as none holds more than 3% of assets. Here again, financials is the top sector accounting for 28%, followed by technology (13%), energy (9%) and consumer staples (9%). Chinese firms dominate the fund’s portfolio at nearly 26%, closely followed by Taiwan (14%) and India (12%). VWO is also by far the most popular fund having an AUM of $43.8 million and an average daily volume of 11.5 million shares. It charges 15 bps in annual fees and expenses. The ETF shed 12.2% in the past three months by touching a new 52-week low of $37.04 per share. Original post