Tag Archives: stocks

Best And Worst Q3’15: All Cap Growth ETFs, Mutual Funds And Key Holdings
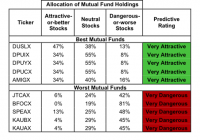
Summary The All Cap Growth style ranks sixth in Q3’15. Based on an aggregation of ratings of 0 ETFs and 494 mutual funds. DUSLX is our top-rated All Cap Growth mutual fund and KAUAX is our worst-rated All Cap Growth mutual fund. The All Cap Growth style ranks sixth out of the 12 fund styles as detailed in our Q3’15 Style Ratings for ETFs and Mutual Funds report. It gets our Neutral rating, which is based on an aggregation of ratings of 0 ETFs (no All Cap Growth ETFs are currently under coverage) and 494 mutual funds in the All Cap Growth style. See a recap of our Q2’15 Style Ratings here. Figure 1 shows the five best and worst rated All Cap Growth mutual funds. Not all All Cap Growth style mutual funds are created the same. The number of holdings varies widely (from 19 to 2177). This variation creates drastically different investment implications and, therefore, ratings. Investors seeking exposure to the All Cap Growth style should buy one of the Attractive-or-better rated mutual funds from Figure 1. Figure 1: Mutual Funds with the Best & Worst Ratings – Top 5 (click to enlarge) * Best ETFs exclude ETFs with TNAs less than $100 million for inadequate liquidity. Sources: New Constructs, LLC and company filings The AMG Renaissance Large Cap Growth Fund (MUTF: MRLIX ) is excluded from Figure 2 because its total net assets are below $100 million and do not meet our liquidity minimums. The DFA U.S. Large Cap Growth Portfolio (MUTF: DUSLX ) is the top-rated All Cap Growth mutual fund. DUSLX earns our Very Attractive rating by allocating over 47% of assets to Attractive-or-better rated stocks. The Federated Kaufmann Fund (MUTF: KAUAX ) is the worst-rated All Cap Growth mutual fund. KAUAX earns our Very Dangerous rating by allocating over 45% of assets to Dangerous-or-worse rated stocks while charging investors total annual costs of 4.45%. International Business Machines (NYSE: IBM ) is one of our favorite stocks held by DUSLX and earns our Attractive rating. Investors should view IBM as a mature cash cow in the tech sector. Over the past decade, IBM has grown after-tax profit ( NOPAT ) by 6% compounded annually. IBM still earns an impressive 13% return on invested capital ( ROIC ) and, over the past five years, has generated $57 billion in free cash flow . While the market worries about IBM’s ability to innovate, prudent investors are presented with a buying opportunity. At its current price of $155/share, IBM has a price to economic book value ( PEBV ) ratio of 0.7. This ratio implies that the market expects IBM’s NOPAT to permanently decline by 30%. However, if IBM can grow NOPAT by only 2% compounded annually over the next decade , the stock is worth $213/share today – a 37% upside. Martin Marietta Materials (NYSE: MLM ), is one of our least favorite stocks held by KAUAX. Since 2006, Martin Marietta’s NOPAT has actually declined by 2% compounded annually. In addition, its ROIC of 5% is well below the 11% achieved in 2006. However, after two years of NOPAT growth in 2013 and 2014, the market has driven MLM up 46%, a level that does not reflect the quality of its business operations. To justify its current price of $153/share, Martin Marietta Materials must grow NOPAT by 20% compounded annually for the next 18 years . Two years of NOPAT growth in 2013-2014 is a nice trend, but it still pales in comparison to the trend implied by the current market price. Investors should avoid MLM because the expectations embedded in the stock price are simply too optimistic. Figures 2 shows the rating landscape of all All Cap Growth mutual funds. Figure 2: Separating the Best Mutual Funds From the Worst Funds (click to enlarge) Sources: New Constructs, LLC and company filings D isclosure: David Trainer and Kyle Guske II receive no compensation to write about any specific stock, style, style or theme. Disclosure: I/we have no positions in any stocks mentioned, and no plans to initiate any positions within the next 72 hours. (More…) I wrote this article myself, and it expresses my own opinions. I am not receiving compensation for it. I have no business relationship with any company whose stock is mentioned in this article.
Market Lab Report – Premarket Pulse 8/14/15

Major averages fell yesterday on lower volume as they reversed off of their intraday highs to close down late in the day. The S&P 500 and NASDAQ Composite met with resistance at their respective 50-day moving averages. That said, the 50-day line has been disrespected a number of times in this sideways market. While the choppiness continues, the sidelines are not a bad place to be until the dust settles. Keep your eye on your watch list of stocks, either long or short, since profit opportunities can come at the least expected moments. Healthcare service provider Molina Healthcare (MOH) had a pocket pivot. It gapped up on a strong earnings report 2 weeks ago. Earnings and sales are strongly accelerating, group rank 31.

Making Sense Of China’s Currency Devaluation

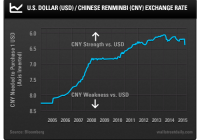
Alan Gula, CFA Earlier this week, two massive explosions rocked the Chinese port city of Tianjin. It’s said that the larger explosion was equivalent to over 20 tons of TNT being detonated. The blasts were so large that seismic activity was registered around 100 miles away. The exact cause of the explosions is unknown, but other shocks emanating from China have clearer triggers. On August 11, 2015, China devalued its currency, the renminbi (yuan), by 1.9%. It was the currency’s biggest one-day drop since 1994. It didn’t stop there, either. At one point the following day, the yuan had cumulatively lost as much as 3.9% of its value against the dollar. Policymakers in China seem to be following through on their promise to allow the market to play a bigger role in determining the exchange rate. “A fixed exchange rate looks stable, but it hides accumulated problems,” noted Yi Gang, Vice Governor of China’s central bank. China doesn’t have a fixed peg, but it does heavily manage the yuan’s level relative to the U.S. dollar. The chart below helps us put the devaluation into perspective. The y-axis has been inverted so that a rising line shows the yuan’s strength. As you can see, China allowed the yuan to significantly appreciate against the dollar from 2005 up until the credit crisis. The fixed peg was reinstituted from mid-2008 until mid-2010. Then, the yuan began a slower appreciation, which culminated in early 2014. So, the yuan’s relatively small recent devaluation has only given back a small portion of its longer-term appreciation. That said, we shouldn’t downplay what’s happening right now. The U.S. dollar bull market has really forced China’s hand. The dollar has been very strong over the past year against virtually all global currencies. Therefore, the yuan has been dragged higher. With a strong currency, China has lost some of its export competitiveness. China has also been burning through foreign exchange reserves to keep the yuan at a level above where it would naturally be. Given that China’s economy is slowing, its exports are flagging, and its speculative bubbles are collapsing, the move wasn’t completely unexpected. Plus, an increasingly market-driven exchange rate will pave the way for the yuan to enter the Special Drawing Rights (SDR) basket. Nonetheless, the market seemed to be surprised by the devaluation. Global equity markets dipped and the U.S. 10-year yield declined all the way to 2.05%. China’s move has sparked fears that a new wave of deflation will wash over the world. A weaker yuan will also help boost China’s exports at the expense of other nations. Koichi Hamada, an adviser to Japan’s Prime Minister, went so far as to say that Japan can offset the yuan devaluation with monetary easing. Indeed, it’s clear to see why there’s a risk of escalating competitive devaluations or “currency wars.” For individual investors, it’s important to keep everything in perspective. Just a little while ago, Greece and Europe were roiling the markets. Now, it’s China’s turn. Soon, there will be something else. If you’re getting spooked by these news-driven stock market plunges, only to buy higher after a fierce rally, you’re doing it wrong. Many traders and investors are simply getting whipsawed by the volatility. Meanwhile, the S&P 500 has effectively gone nowhere since the Fed’s latest quantitative easing (QE3) program ended. This is why everyone should hold globally diversified portfolios of stocks, preferred stocks, bonds, and real assets. There are going to be more (and much larger) disturbances down the road, and their timing is uncertain. By being properly diversified and intelligently taking on risk, you’ll protect yourself from the market shocks and volatility storms coming our way. Original Post