Tag Archives: stocks

The Global X MSCI Colombia ETF: Rebound From 52-Week Lows
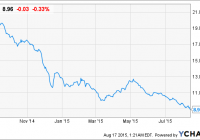
Summary Colombia is projected to have the highest Annual GDP Growth in Latin America in the next 12 months. The Global X MSCI Colombia ETF is trading below its book value and is also trading at its 52 week low. The fund has witnessed a sharp decline in its price since 2014, yet financial performance of the fund’s top 10 holdings during this year was favorable. General exposure to this ETF is a wise endeavor, while specifically investing in the banking industry may be wiser, due to its lower valuation and superior financial performance during 2014. Given the current low oil price environment, Colombia is certainly a country worth investigating for a potential rebound, as the Global X MSCI Colombia ETF (NYSEARCA: GXG ) has witnessed a sharp decline in price since September 2014; the fund reached a high of 20.78 around this time and is now trading at 8.96. Despite the risks associated with its economy being dependent on oil exports, and the fact that it has had the highest political risk among countries in Latin America, there are still ample opportunities to be found after investigating the valuation and current price of this ETF; the fund is trading below its book value and is also trading at its 52 week low. Moreover, Colombia has been among one of the fastest growing countries in Latin America, and has the highest economic growth projections for the next twelve months. GXG data by YCharts Global X MSCI Colombia ETF The fund has been consistently declining since 2014, and is extremely far from its 52 week high of 20.78. The recent decline in the price of oil has attributed to a drop in the fund’s price, and has consequently created attractive valuation : P/E ratio: 15.91 P/B ratio: 0.92 P/S ratio: 1.01 The fund’s holdings are extremely diverse, and invest into the following industries: Financial Services: 36.74% Basic Materials: 16.85% Utilities: 16.46% Industrials: 6.66% Economic Outlook Colombia has a favorable economic outlook for the next twelve months, and will lead Latin America in Annual GDP Growth. The following projections have been made for the 2nd quarter of 2016 Annual GDP Growth will increase from 2.8% to 3.2%. Inflation will remain near 4.4%. Exports will decrease by 3.1%. FDI will increase by 22.9%. Crude oil production will decrease by 0.7%. Retail sales will increase by 4.42%. Consumer spending will increase by 3.2%. Consumer credit will increase by 10.4%. Overall economic projections for the next twelve months appear to be very favorable for the country, with slight Annual GDP growth projected for the next twelve months. An increased trend of consumption and retail sales is projected for the next twelve months, which will further attribute to economic growth. Most important to note, is that the low oil price environment has not deterred FDI, as this is projected to increase by 22.9% during the next 12 months. Latin America Annual GDP Growth Comparison Recently Colombia has had the highest Annual GDP Growth, and is on track for higher economic growth during the next twelve months. While Peru and Chile have ample potential for long term recovery due to the current adverse impact of low commodity prices, a twelve month outlook provides the most favorable results for Colombia. Annual GDP Growth 2012 2013 2014 Current 2nd Quarter 2016 Projections Colombia 4 4.9 4.6 2.8 3.2 Peru 6 5.8 2.4 1.7 2.03 Argentina 0.8 2.9 0.5 1.1 0.76 Chile 5.5 4.2 1.9 2.41 2.37 Brazil 1.8 2.7 0.1 -1.6 -0.3 Source: World Bank Top 10 Holdings Overall, the financial performance of the fund’s top ten holdings has been exceptional, which makes the fund’s sharp drop in price somewhat undeserved. The fund’s holdings had a 10.6% increase in net revenue and a 10.8% increase in net income. An industry specific approach provides a mixed outlook regarding valuation and financial performance: The banking industry can be considered superior, due to its extremely attractive valuation and having exceptional growth. The utilities industry also had exceptional growth, and its valuation is relatively attractive. The consumer products industry has relatively attractive valuation, but experienced negligent growth. Increased projections for consumer spending will be a positive driver for future growth. The construction industry had substantial growth, but also has extremely high valuation. For risk seeking investors, the main holding in the oil industry has low valuation, although financial performance was not favorable in 2014. Value Based Approach Ecopetrol S.A and Bancolombia SA are two options for valued based investors to gain exposure to Colombia, as both companies have lower valuation than the ETF. Bancolombia SA’s historical P/E has been exceptionally higher in the past, with a five year P/E high of 38.61 . The banking industry holdings in the fund were among the top performing, and Bancolombia SA is a superior pick considering its net income increased by 24% while the fund’s price dropped substantially. Ecopetrol SA is a riskier pick as its net income and net revenue have been consistently declining since 2012, and sole exposure to this industry may be risky. However, valuation is the lowest of the fund’s top 10 holdings. Conclusion Now is an strategic moment for investors to gain access to Colombia’s growth, which is set to outpace other countries in Latin America during the next twelve months. The low oil price environment has created attractive valuation for the Global X MSCI Colombia ETF, which is further edified by the projected growth for Colombia. General exposure to this ETF is a wise endeavor, while specifically investing in the banking industry may be wiser, due to its lower valuation and superior financial performance during 2014. Disclosure: I/we have no positions in any stocks mentioned, and no plans to initiate any positions within the next 72 hours. (More…) I wrote this article myself, and it expresses my own opinions. I am not receiving compensation for it (other than from Seeking Alpha). I have no business relationship with any company whose stock is mentioned in this article.
My Latest Additions To The Portfolio

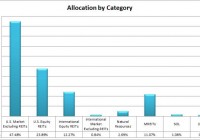
Summary I’ll take readers through a look at my personal portfolio. My biggest individual company weights are still Freeport-McMoRan and Dynex Capital. The allocation to Freeport-McMoRan continues to shrink as shares drop in value most days. In the first half of August, I used up most of the cash I had piled up. I bought shares of SCHH, SCHB, SCHF, and DX. I have a bias to see a drop in indexes, assume it is a dip (temporary) and buy into it. It’s useful for readers to have a solid disclosure about the investing choices of the analysts they follow. Seeing the choices the analysts have personally made and what plans the analysts have for their future investing choices provide other investors the opportunity to better understand the mindset of the analysts and determine how they feel about the quality of the analysts’ research. The first thing investors are likely to notice is that my holdings include a few tickers with large amounts of overlap. The reason for that is because I focus on allocation by category rather than allocation by ticker. Therefore, I will use the cheapest ticker that adds the desired allocation, which results in buying different tickers at different points and in different accounts. My brokerage accounts are spread out among a few brokerages; therefore, some accounts have free trading on different tickers. For this reason, you will see VTI, FSTVX, and SCHB all in my portfolio even though they are practically identical. Holdings My holdings are: Vanguard Total Stock Market ETF (NYSEARCA: VTI ), Fidelity Spartan® Total Market Index Fund – Fidelity Advantage Class (MUTF: FSTVX ) Schwab U.S. Broad Market ETF (NYSEARCA: SCHB ) Fidelity Spartan® Real Estate Index Fund – Fidelity Advantage® Class (MUTF: FSRVX ) Schwab U.S. REIT ETF (NYSEARCA: SCHH ) Vanguard REIT Index ETF (NYSEARCA: VNQ ) Vanguard Global ex-U.S. Real Estate ETF (NASDAQ: VNQI ) Schwab International Equity ETF (NYSEARCA: SCHF ) Freeport-McMoRan (NYSE: FCX ) Dynex Capital (NYSE: DX ) ReneSola (NYSE: SOL ) My Strategy By observing my own behavior in hindsight, I find that I display a bias towards buying things that are dipping. When it comes to companies, that strategy can lead me to attempting to catch a “falling knife.” To combat that issue, I try to keep most of my portfolio invested in highly diversified indexes where I feel buying on dips is safer. When I do venture into buying individual companies, I want to keep the purchases to my area of greatest expertise, the mREIT sector. What I Bought During the month, I heavily displayed my bias to buy on sudden drops in price. I purchased SCHH, DX, SCHB, and SCHF. During July, I was working to increase the amount I held in cash so I could look for compelling opportunities. During the first half of August, I spent most of the cash. Let’s go over what I purchased and why. I’ll provide the date of the transaction and the average price. On August 6th, I bought some SCHH on a dip when my limit order activated. The average price was $37.85, and the current price is $39.07. On August 7th, I saw shares of Dynex Capital falling hard. I had just published on DX explaining that the sell-off on the earnings release was overdone and a second day of shares falling hard pushed me to act. I put in a limit order at $6.41, and backed it up with almost all the cash in my portfolio. I only got partial execution on the order and acted as a floor on the price for the day. Current price is $6.95. On August 12th, the markets opened substantially lower. By my calculations, I had a large enough percentage allocation to domestic whole stock market indexes, but seeing SCHB trading under $50.00 was enough for me to buy. I tossed on a limit order for $49.85. It hit in early trading. Shares are currently $50.82. Right after putting in the trade for SCHB, I added another trade for SCHF. My international equity allocation is about where it should be but the major exposure is through VNQI. I have decided I prefer SCHF over VNQI because it offers a lower exposure and the international exposure is to more developed markets. I originally picked up VNQI because I wanted to use international REITs to gain more diversification and was going to pair it with SCHF. As it stands, I may sell off part or all of my position in VNQI and allocate part or all of the funds to SCHF. I did the same thing with SCHF and put in a limit buy order a little under the current price and acquired my shares at $30.03. Current price for SCHF is $30.38. Lessons Learned Sometimes, it is better to be lucky than good. I have a tendency to buy index funds on dips and some day that will bite me when I buy in right at the start of a hard crash. When the market is not crashing, I may be more likely to see small positive returns. When it came to providing a floor on DX, there was much more thorough analysis than simply saying: “Hey that index fund looks cheaper than normal.” With Dynex Capital, I put in some serious time during the day testing my assumptions and looking for any solid justification for the mREIT to fall so hard. After a thorough analysis, I determined that the drop in price was the result of scared investors selling their shares in a panic. To me, that situation reflects the strategy: “Buy when there is blood in the streets.” I had enough cash in my portfolio to double down on my position in Dynex Capital but the share price bounced slightly before closing, and I wasn’t able to buy as many shares as I was trying to acquire. Below are two charts showing my allocation by asset category and my allocation by ticker. The charts lump together several accounts across several brokerages to represent all of the investment accounts owned by either myself or my wife. I have POA (Power of Attorney) on her account and handle all of her investment decisions. (click to enlarge) (click to enlarge) Conclusion In early August, there were a couple dips in the equity indexes, and I decided to unload my cash. My largest purchase by a substantial margin was adding to my position in Dynex Capital. Since I couldn’t get full execution there, I ended up using the cash the following week to buy some SCHB and SCHF when the prices dropped. For the rest of August, I’m not expecting any trades; however, I do plan to deposit more money into the accounts and if I see another big dip in the equity market, I may toss a limit buy order in. All REIT investments are held in tax-advantaged accounts. I consider the current allocation fairly reasonable, but I would like to raise my cash holdings and shift some international equity REITs into international markets (non-REITs). Since I feel very comfortable holding a large allocation to U.S. equity REITs, I may look to push that percentage higher as well. I’m fairly comfortable with that going up to around 30% of total value, so long as it can be done through tax-advantaged accounts. Disclosure: I am/we are long DX, FCX, FSRVX, FSTVX, SCHB, SCHF, SCHH, SOL, VNQ, VNQI, VTI. (More…) I wrote this article myself, and it expresses my own opinions. I am not receiving compensation for it (other than from Seeking Alpha). I have no business relationship with any company whose stock is mentioned in this article. Additional disclosure: Information in this article represents the opinion of the analyst. All statements are represented as opinions, rather than facts, and should not be construed as advice to buy or sell a security. Ratings of “outperform” and “underperform” reflect the analyst’s estimation of a divergence between the market value for a security and the price that would be appropriate given the potential for risks and returns relative to other securities. The analyst does not know your particular objectives for returns or constraints upon investing. All investors are encouraged to do their own research before making any investment decision. Information is regularly obtained from Yahoo Finance, Google Finance, and SEC Database. If Yahoo, Google, or the SEC database contained faulty or old information it could be incorporated into my analysis.