Tag Archives: stocks

4 Small-Cap ETFs For A Bumpy Japan Ride

Japan has been on an uneven recovery path with wild fluctuations seen in recent quarters. This is especially true as the country lost its momentum yet again, snapping two quarters of expansion. The economy contracted 1.6% year over year in the second quarter compared to a solid 4.5% growth in the first quarter. However, this is slightly better than the market expectation of a 1.8% decline. A drop in consumer spending, weak exports and lower private consumption continued to weigh on the growth of the world’s third-largest economy. The slump in Japan’s biggest trading partner – China – added to the woes. The slowdown seems to be a major setback for Prime Minister Shinzo Abe and his reform policy – Abenomics – which is aimed at pulling the country out of two decades of deflationary pressure and returning to growth. More Stimulus in the Cards? Sluggish growth has raised speculations of additional monetary and fiscal stimulus by the central bank later in the year to boost growth. Earlier this month, Bank of Japan (BoJ) announced that it is seeking expansion in its massive asset purchase at 80 trillion yen per year if lower oil prices continue to hold back inflation at a near-zero level. The bank recently cut its annual growth outlook to 1.7% from 2% and inflation to 0.7% from 0.8% for this year. However, many economists believe that the slowdown in the second quarter was because of temporary factors, mainly the China turmoil, and that the Japanese economy will return to growth in the ongoing quarter. According to Capital Economics, Japan will return to a modest growth in the third quarter and see 1% growth for the full year. Further, as per the survey by the Japan Center for Economic Research, 40 analysts project that growth would rebound by an average 2.5% in the third quarter. This could be easily depicted in the solid manufacturing PMI data, which showed that business activity expanded in July with broad-based improvement in output, new orders, employment and exports. Notably, the PMI index climbed to 51.2 in July from 50.1 in June. Exports recovered in July on cheap yen. This is because Japan is primarily an export-oriented economy and a weaker currency makes its exports more competitive. Rise in exports and hopes of further stimulus measures would boost the stock prices in the coming months. While the rally will likely take place across various market spectrums, small caps will benefit the most, as these are less vulnerable to China’s uncertainty or any other external threat. Below, we take a look at four ETFs, which track the small-cap segment of the Japanese stock market. All of these funds offer access to pint-sized securities in the nation. These are likely to see higher volatility yet deliver better returns if the Japanese economy trends in the right direction. WisdomTree Japan SmallCap Dividend Fund (NYSEARCA: DFJ ) This fund targets the dividend-paying small-cap stocks by tracking the WisdomTree Japan SmallCap Dividend Index. Holding 598 securities in its basket, it has a spread out exposure to various components as each firm holds less than 0.9% of total assets. From a sector look, industrials and consumer discretionary take the top two spots with one-fourth share each, while materials, financials and information technology round off the next three with double-digit allocation each. The product has amassed $335 million in its asset base while trades in a lower volume of under 36,000 shares. It charges an annual fee of 58 bps and has gained about 2.4% over the past three months. The fund has a Zacks ETF Rank of 2 or ‘Buy’ rating with a Medium risk outlook. iShares MSCI Japan Small-Cap ETF (NYSEARCA: SCJ ) This fund follows the MSCI Japan Small Cap Index and holds 798 stocks in its basket. It is widely spread out across components with none holding more than 0.86% of assets. However, about one-fourth of the portfolio is allotted to industrials, closely followed by financials (18.7%) and consumer discretionary (18.2%). The fund has managed AUM of $339 million while sees lower average daily volume of around 38,000 shares. Expense ratio came in at 0.48%. The fund has added 1.7% over the past three months and has a Zacks ETF Rank of 2 with a Medium risk outlook. SPDR Russell/Nomura Small Cap Japan ETF (NYSEARCA: JSC ) This is the illiquid and unpopular ETF in the Japanese space with AUM of $66.3 million and average daily volume of just 3,000 shares per day. It tracks the Russell/Nomura Japan Small Cap Index, charging investors 40 bps in annual fees. In total, the fund holds well-diversified 692 securities in its basket with none accounting for more than 0.61% of assets. Here again, industrials make up for the top sector at 26.1%, closely followed by consumer discretionary (21.3%). The product is up 2.6% over the trailing three-month period and has a Zacks ETF Rank of 2 with a Medium risk outlook. WisdomTree Japan Hedged SmallCap Equity Fund (NASDAQ: DXJS ) DXJS offers exposure to the Japanese small-cap stocks while at the same time provides hedge against any fall in the Japanese yen. This is easily done by tracking the WisdomTree Japan Hedged SmallCap Equity Index. The fund has accumulated $207 million in its asset base and charges 58 bps in fees per year from investors. Volume is moderate as it exchanges 61,000 shares in hand per day on average. The product holds 619 stocks in its basket with none accounting for more than 0.94% of assets. Industrials and consumer discretionary and industrials take the top two spots with at least 24% share each, while materials, finance and information technology round off the top five. The ETF gained 6.7% in the same period. Bottom Line These small cap Japan ETFs hit a new 52-week high last week and are clearly outpacing the broad fund (NYSEARCA: EWJ ). Given the China turmoil and global growth concerns, these funds seem safer choices to play the recovering Japanese economy. Original Post
Tech Stocks Traded Most Today: Sprint, Apple And …

Solar company SunEdison (SUNE), Sprint (S) and Apple (AAPL) made up the market’s most active tech stocks Tuesday. Micron Technology (MU) and Cisco Systems (CSCO) also moved in high volume, as didMicrosoft (MSFT) and Facebook (FB), with the latter up more than 1% after an analyst price target hike. Solar Shares Fly Trading in SunEdison stock neared 66 million shares in the stock market today, more than triple its average volume. SunEdison fell a

SPDR Barclays Capital High Yield Bond ETF: Great Yields And An Intelligent Portfolio

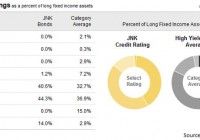
Summary The SPDR Barclays Capital High Yield Bond ETF is a junk bond fund that offers a fairly strong yield, around 6%. One concern is that 14% of the debt is not rated. The exposure to debt that is not rated may be an acceptable trade-off for the strong yields as long as the portfolio managers are doing their own due diligence. The maturities look fairly reasonable and holdings are not highly concentrated, so the overall portfolio construction looks solid. Investors should be using more than junk bonds in their investment portfolio. Correlation to the S&P 500 is a problem for junk bond ETFs. The SPDR Barclays Capital High Yield Bond ETF (NYSEARCA: JNK ) is a pretty good bond fund for exposure to securities ranging from BB to “Not Rated,” though nothing in the portfolio is actually rated anything less than B. The credit ratings won’t be stellar on a junk bond fund and the fund sure doesn’t try to hide it. Their ticker symbol of JNK is simply a play on “junk.” Every buy should know going in that they are buying credit sensitive debt securities. Credit Quality The allocation here seems is perfectly reasonable with the exception that a large amount of not rated bonds is slightly concerning: (click to enlarge) While I would like to have ratings on all or almost all of the debt being held, I can see how having debt that is not rated may be an advantage in producing higher yields if the portfolio managers are willing to do the due diligence to determine what the most likely rating would be if it were rated. In my opinion, this is an acceptable trade-off when most funds have weak yields and JNK is yielding around 6%. In a normal interest rate environment investors may expect materially higher yields, but in the weak yield environment we are all living through, this is one of the higher yielding debt options. Holdings I prepared the following chart showing the largest debt holdings of JNK. (click to enlarge) No problems are jumping out at me. Nothing was over .6% of the portfolio and within the top 10 I don’t see any duplication of the same issuers so I have no reason to expect a concentration of credit risk with individual issuers. Since about 14% of the portfolio was non-rated, it felt more important to double check for any large holdings that might be attributed to one non-rated company. Maturities I grabbed another chart to show the maturity ranges across the portfolio: (click to enlarge) The maturity profile for the SPDR Barclays Capital High Yield Bond ETF looks good for a junk bond fund. However, I must admit that the tiny allocations to the very long-term debt are interesting. Yes, there are generally lower than the category averages but I assume that the category averages may be influenced by a few funds classified into the category that have different investing strategies. Simply put, this is a little strange because it feels like the managers by operating outside of their area of expertise (evaluating short-term credit sensitive debt). On the other hand, these longer securities may simply be bargains they came across while doing their regular work. With it being such a small percentage of the portfolio, I don’t think it is worth worrying about. On the whole, JNK gets a solid rating on providing some diversification across the maturities without becoming too dispersed. There is not one “right” answer about how to structure the maturities, but I like the arrangement shown here. Risk The biggest risk factor from a portfolio standpoint that came up for me was a strong correlation (over 70%) in monthly returns with the S&P 500. Since one purpose of the bond portion of the portfolio is to provide diversification, it is a strike against junk bond funds that they tend to move with the market. That is a problem that should be impacting most junk bonds though, not a risk unique to JNK. When comparing JNK to other junk bond funds, this should not be held against it. Expense Ratio The expense ratio isn’t awful at .40%, however, I still want to keep looking for options where the ratio is lower. Given the relatively low yields on bonds currently and the need to buy junk bonds to get a solid yield, it really hurts to give up a significant portion of the assets to the expense ratio each year. Conclusion If an investor is looking at the role of the bond fund in their portfolio, it would be wise to consider having multiple bond funds if the first one is going to be investing in junk bonds. This kind of fund can offer some diversification benefits to investors, but it would be most productive in a portfolio that combines it with a few other bond funds with different duration exposures and higher credit ratings to enhance the diversification benefits that bonds bring to the investor’s portfolio. When it comes simply to selecting which junk bond fund an investor should use, JNK seems like a decent choice. I’ve still got quite a few funds to consider, but I’m not seeing any major failings here so far. I’m looking for a similar ETF with a very low expense ratio to really stand out as a junk bond fund champion. Disclosure: I/we have no positions in any stocks mentioned, and no plans to initiate any positions within the next 72 hours. (More…) I wrote this article myself, and it expresses my own opinions. I am not receiving compensation for it (other than from Seeking Alpha). I have no business relationship with any company whose stock is mentioned in this article. Additional disclosure: Information in this article represents the opinion of the analyst. All statements are represented as opinions, rather than facts, and should not be construed as advice to buy or sell a security. Ratings of “outperform” and “underperform” reflect the analyst’s estimation of a divergence between the market value for a security and the price that would be appropriate given the potential for risks and returns relative to other securities. The analyst does not know your particular objectives for returns or constraints upon investing. All investors are encouraged to do their own research before making any investment decision. Information is regularly obtained from Yahoo Finance, Google Finance, and SEC Database. If Yahoo, Google, or the SEC database contained faulty or old information it could be incorporated into my analysis.