Tag Archives: stocks

Market Lab Report – Pocket Pivot Review for the Week of 11/16-11/20 2015
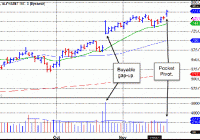
Trading Journal notes from Dr. K and Gil regarding this past week’s pocket pivot reports.  Pocket Pivots: Alphabet (GOOGL) DRK – supercap technology stocks have been leading the market as shown in the performance of the NASDAQ-100 which is comprised of the larger cap tech stocks. GOOGL gapped higher on its prior earnings report and has since moved higher. In a risk-on environment, the largest cap leading names tend to outperform the smaller cap names as the Russell 2000 has been severely lagging. GM – this pocket pivot is coming off the 10-day line in continuation fashion following a buyable gap-up after the company announced earnings in late October. In a case like this my preference would be to buy the supporting day at the 20-day moving average five days ago on the chart while looking for some sort of low-volume pullback into the 10-day line as a lower-risk entry.  Luxoft Holdings (LXFT) DRK – stock gapped higher on its prior earnings report, and since has traded sideways in constructive fashion. Its pocket pivot if still within the sideways consolidation so could have been bought. Since 5 days have passed since the gap higher, should the stock break below the low of the gap up day, it should be sold. A 2-3% allowance under the low of the gap up day is allowed if it occurs within 5 days after the gap up day. GM – company is a small player in outsourced IT services and relatively thinly traded at about 229,000 shares a day. I’ve noticed that the spread on this puppy can get as much as 40-50 cents wide during certain times of the day, which makes it a little difficult to buy or sell at times. But it may be “revving up” to move higher with a number of pocket pivots and a buyable gap-up in the pattern. ServiceNow (NOW) DRK – breaking out to new highs so is extended. It could be bought on a pullback to its 10dma. GM – This is probably best bought on low-volume pullbacks into the 10-day line. Notice how trying to chase Wednesday’s pocket pivot as the stock moved higher on Thursday or Friday was probably late as the stock stalled out and closed at the lows of its trading range on both of those days. INC Research Holdings (INCR) DRK – just broke above its double bottom midpoint. The right side of double bottoms should have stronger upside thrust especially in an uptrending market. This is a sign of weakness in the pattern. On the other hand, earnings have been soaring over the last several quarters, but keep in mind that future earnings surprises are more important than what everyone already knows. GM – this stock is actually trying to break out through the mid-point of a double-bottom type of base. The middle peak of the “W” in the double-bottom is the peak at the right of the chart, and you can see how the stock broke out through that high on above-average volume on Friday. Of course, buying as close to the 10-day line as possible following the pocket pivot on Tuesday gets you in earlier.  Integrated Device Technology (IDTI) DRK – this gapped higher on its prior earnings report, then undercut the low of the gap up day by -2.6% so could have been held. It is now extended as it breaks out to new highs. GM – this has been one of the strongest semiconductor names in the market since early October, and we have reported on this several times on the way up as it has flashed pocket pivots along the 10-day line. Tuesday’s pocket pivot led to a breakout later in the week, so from here you’d want to wait for a low-volume pullback back into the 10-day line.  

Nondomestic Equity Funds Continue To Attract Money

By Patrick Keon In every year, except one, since the global financial crisis, nondomestic equity funds have experienced overall net inflows. The one exception occurred in 2012, when the group suffered $3.0 billion of net outflows. Conversely, domestic equity funds have had net outflows every year since the global financial crisis except for 2013, when the group took in just over $79 billion of net new money. This trend has been amplified so far in 2015. The gap between the two types of funds has never been so wide, with nondomestic equity funds experiencing positive flows of over $104 billion for the year to date, while domestic equity funds have seen almost $101 billion leave their coffers. The positive flows into nondomestic equity funds this year have been dominated by funds in Lipper’s International Multi-Cap Core (IMLC) classification; the group has taken in $72.2 billion of net new money, while International Large-Cap Core Funds (ILCC) and Emerging Markets Funds have contributed $14.1 billion and $6.1 billion of net inflows to the nondomestic equity funds’ total positive flows. The Vanguard Total International Stock Index Fund (MUTF: VGTSX ) has taken in the lion’s share of the net new money within IMLC, with net inflows of over $54 billion for the year so far. The activity within ILCC has been a little more widespread, with the Bridge Builder International Equity Fund ( BBIEX , +$2.3 billion), the Ivy International Core Equity Fund ( IVIAX , +$1.8 billion), and the T. Rowe Price Overseas Stock Fund ( TROSX , +$1.5 billion) contributing the most to the group’s total. Within the Emerging Markets Funds classification, there have been seven funds that have taken in over $1 billion of net new money for the year to date. The largest net inflows belong to two Fidelity funds: Fidelity Strategic Advisers Emerging Markets Fund ( FSAMX , +$3.5 billion) and Fidelity Series Emerging Markets Fund ( FEMSX , $2.7 billion).

Restaurant Investing: What Early Investors Should Look For In An IPO Opportunity

Summary What are the telltale signs that a company’s stock is worth its post-IPO price? Do investors need to look beyond mere hype to make such a crucial decision as putting their money into a business? What are the metrics that an investor needs to closely review before making that investment decision? Photo Courtesy: Value in Wall Street Investing in a company that’s going to IPO is a difficult decision to make. With all the hype surrounding restaurant IPOs these past five years, the abundance of “noise” made by early investors and even the companies themselves drowns out the “right noises” that should be heard by anyone interested in getting in. Introduction The first point to remember is that it is never too late to invest in a stock as long as the company has a solid foundation of financial and operational management. In that respect, the CEO and CFO are the most important people to get to know because they carry the bulk of the responsibility for managing operations and finances. The second point – a deeper one – is how they’ve been performing in the years preceding the IPO. Very often, investors will merely look at the current revenues or average sales volume or unit growth published in the IPO prospectus, read a few articles from expert financial analysts and then jump headlong into the investment. More often than not – and this is because the vast majority of investors can’t actually get in at the IPO price – they are forced to buy at prices much higher than the actual performance of the company warrants. To help investors make better decisions, we’ve studied one of the best performing companies of this decade and showcased their metrics to elucidate what we mean when we say that management and margins should be the factors driving investor sentiment – and not the “campaigning” surrounding an initial public offering. Background For the purpose of this showcase, we’ll be looking at Chipotle (NYSE: CMG ), which is one of the top performers in the fast casual segment. In an earlier article, we discussed how this burrito maker crushed 3 prevalent myths about restaurant investing. In this article, we’ll see something entirely different: what were those early signs that told us that this was going to be a good company to invest in? The end objective here is to allow investors a deeper and broader insight into the decision-making process that should necessarily precede an IPO investment. With close to 1,800 restaurants efficiently serving burritos and other Mexican fare since the 90s, CMG is a fast casual restaurant that boasts one of the highest AUVs in the segment – $2.47 million over the last full fiscal (2014). Consider that its AUV growth for the three years preceding the IPO stood at above 6%, and you’ll know that comp sales growth contributed to a large part of that – growing an average of 16% in the three years before going public – as did aggressive but well-planned unit growth, which saw units go from 229 at the beginning of 2003 to 481 at the end of 2005 – a growth of 210%. When all these factors work together, they produce a solid foundation on which to base an investment decision. Of course, not all companies can boast stellar numbers before their IPO year, but the fact remains that these indications must necessarily be there in part. Anything less would likely miss the whole point of investing – to acquire, hold on to and benefit from a share of a consistently profitable public company. Analysis If you had delved into Chipotle’s margins reports for the five years preceding the IPO, this is what you would have seen: Strong cost control action on several fronts like occupancy, labor, food and pre-opening costs. An operating cost that went from 118% of revenue to 95% of revenue in 5 years. A net income percentage that grew from -18% to over 6% during that time. Five Years Pre-IPO Fiscal year 2005 2004 2003 2002 2001 Total revenue 100.00% 100.00% 100.00% 100.00% 100.00% Food, beverage and packaging costs 32.23% 32.75% 33.25% 33.07% 34.37% Labor costs 28.47% 29.63% 29.80% 32.50% 34.99% Occupancy costs 7.59% 7.69% 8.10% 9.15% 8.92% Other operating costs 13.22% 13.65% 13.80% 14.56% 16.38% General and administrative expenses 8.28% 9.53% 10.84% 12.61% 15.72% Depreciation and amortization 4.46% 4.63% 4.78% 5.50% 6.63% Pre-opening costs 0.31% 0.47% 0.52% 0.50% 1.71% Loss on disposal of assets 0.50% 0.36% 1.43% 0.73% 0.06% Total costs and expenses 95.06% 98.70% 102.51% 108.62% 118.79% Income (loss) from operations 4.94% 1.30% -2.51% -8.62% -18.79% Income (loss) before income taxes 4.82% 1.30% -2.44% -8.45% -18.24% Net income (loss) 6.01% 1.30% -2.44% -8.45% -18.24% If that data weren’t sufficient, you could have taken a look at its comparable store sales and average unit volumes, which were equally impressive: 6% growth in average unit volume for the three years preceding the IPO. 16% comp sales growth average for the period. Fiscal Year 2005 2004 2003 Average Restaurant Sales $1,440 $1,361 $1,274 Comparable Store Sales 10.20% 13.30% 24.40% If you still weren’t convinced, you could have looked into how fast it was growing its stores: A jump of 270% in the number of stores – all company-owned – between the beginning of 2001 and the end of 2005. Fiscal Year 2005 2004 2003 2002 2001 Units 481 401 298 229 177 Conclusion From what you would have seen of its Margins, Comp Sales, AUVs and Unit Growth in the 3-5 year period before it went IPO, you would have realized that this is a company with strong management and bright prospects for the future. So what about companies that are going IPO now or in the near future? Well, take a look at their metrics – just like we did for Chipotle for the years leading up to the IPO. Do they show strong or improving margins? Or both? Are they steadily growing their stores while keeping their pre-opening costs, occupancy and other current liabilities in check? Is their AUV improving or at least holding while they add more units? Are they going overboard on G&A using unit growth as the reason? Are their prime costs (food and labor) within reasonable bounds for the segment? These are questions that every investor in an IPO must necessarily ask. While this is no guarantee that a company that shows these positive indicators will make you money in the future, it gives you as educated a perspective to make your decision from as possible. Over the next week, we’ll be covering several recently-gone IPOs in the restaurant industry to try and arrive at some common denominators that underline strong performance and stability in a company. If you enjoyed this article, we’d be pleased as punch if you would do us the honor of reviewing our extensive coverage of major and minor players in the restaurant industry, and commenting candidly on what you think about them. Click here to see all other articles in our profile page. Some of the companies where investors were affected by “IPO-itis”: Potbelly (NASDAQ: PBPB ) PBPB data by YCharts Wingstop (NASDAQ: WING ) WING data by YCharts The Habit Restaurants (NASDAQ: HABT ) HABT data by YCharts El Pollo Loco (NASDAQ: LOCO ) LOCO data by YCharts Bojangles’ (NASDAQ: BOJA ) BOJA data by YCharts