Tag Archives: seeking

UBS Rolls Out Leveraged US Small Cap Dividend ETN

Concerns related to dividend ETFs are evident, given higher chances of the Fed hiking interest rates sooner than expected in the U.S. Yet, income ETFs draw enough attention thanks to persistent global turmoil (read: 3 ETFs Yielding Over 6% to Watch as Market Speculates Rising Rates ). There are plenty of options in this space too, as a number of providers launched new dividend ETFs over the past few months. While the space is definitely jam-packed, UBS – a leader in exchange-traded notes – discovered room for yet another play in the leveraged dividend ETF space. Consequently, the company rolled out a new income fund namely ETRACS Monthly Pay 2xleveraged US Small Cap High Dividend ETN (NYSEARCA: SMHD ) targeting the U.S. small-cap space. Inside SMHD This ETN looks to follow two times the monthly performance of the Solactive US Small Cap High Dividend Index. This benchmark consists of 100 high dividend yielding small cap U.S. firms. Top holdings for the ETN’s underlying index include LinnCo LLC (NASDAQ: LNCO ) (5.98%), Denbury Resources (NYSE: DNR ) (5.75%) and Peabody Energy (NYSE: BTU ) (5.22%), all of which account for over 15% of the note. In terms of yield, the index pays about 17% per annum (as of February 3, 2015) to investors, a pretty solid level. And for such a smart exposure, the cost does not seem steep as the product charges 85 bps in fees, which is lower than the average expense ratio charged by the leveraged equity ETFs. As far as country exposure is concerned, the product puts about 93.6% of assets in the U.S. followed by Bermuda (5.3%) and United Kingdom (1.1%). Investors should note that the product carries the credit risk of UBS AG (NYSE: UBS ) attached to it, though the issuer is considered a high-rated and sought after financial institution. How Does it Fit in a Portfolio? This ETF is an intriguing choice for investors seeking a new take on income investing. It could also be appropriate for investors seeking to ride out the U.S. growth momentum amid global meltdown and earn substantial yield as the domestic economy seems set to hike the key interest rates this year. Notably, given the currency concerns and global turmoil, small-caps appear better bets than large caps when it comes to investing in the domestic arena. After all, these pint-sized equities revolve around the domestic economy more than the large caps, which normally have a wider foothold abroad (read: Investor Guide to Small-Cap Value ETFs ). On the other hand, the ETN does not look to be a pricier option giving investors another reason to bend towards it. Plus, a monthly rebalancing strategy is a winning criterion in the leveraged space as many other products rebalance on a daily basis, enhancing the risk quotient in the product (read: UBS Launches New Monthly Resetting Leveraged ETF ). Meet the Competitors The leveraged high yield space is still not chockablock. Among the trendy and coveted ones, UBS itself operates two products namely UBS ETRACS Monthly Pay 2x leveraged Dow Jones Select Dividend Index ETN (NYSEARCA: DVYL ) and UBS ETRACS Monthly Pay 2x leveraged S&P Dividend ETN (NYSEARCA: SDYL ) . While SDYL targets a monthly 2x version of the 50 highest dividend yielding firms in the S&P Composite 1500 Index and DVYL focuses on the Dow Jones U.S. Select Dividend Index which screens by the dividend per share growth rate, dividend payout percentages, and average dollar trading volume, and then selects on the basis of dividend yield. SDYL has an asset base of $21.9 million and charges 30 bps in fees while DVYL has so far amassed about $33 million in assets and charges about 35 bps in fees. SDYL yields 4.45% in dividends annually (as of February 13, 2015) and DVYL yields 6.50%. Considering these options, the small-cap concept is fresh in the leveraged equities ETF space and should not face much problem in hoarding investors’ money. Though the product is priced higher than the issuers’ older offerings, a novel theme and a substantially higher yield opportunity should more than compensate for increased costs.
A New Exercise In Industry Rotation

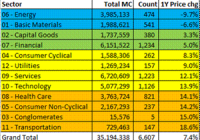
At Abnormal Returns, over the weekend , Tadas Viskanta featured a free article from Credit Suisse called the Credit Suisse Global Investment Returns Yearbook 2015 . It featured articles on whether the returns on industries as a whole mean-revert or have momentum, whether there is a valuation effect on industry returns, “social responsibility” in investing, and the existence of equity discount rate for the market as a whole. There are no surprises in the articles – it is all “dog bites man.” They find that: Industry returns exhibit momentum. There is a valuation component in industry returns. Socially responsible investing doesn’t necessarily produce or miss excess returns. There is an overall equity discount rate, which is levered about 20-25 times, i.e., a 1% increase in the rate lowers valuations by 20-25%. The first two are well known for individual stocks, so it isn’t surprising that it happens at the industry level. The third one has been written about ad nauseam, with many conflicting opinions, so that there is little effect is no big surprise. The last one resembles research I saw in the mid-90s, where the effect of changes in real interest rates has about that impact on stocks. Again, nothing new – which is as it should be. But now some more on industry returns. They found that industry return momentum was significant. Industries that did well one year were likely to do well in the next year. The second finding was that industries with cheap valuations also tended to do well, but it was a smaller effect. So, using one-year price returns as my momentum variable and book-to-market as a valuation variable (both suggested in the article), I divided industries for companies trading in the US into quintiles (also suggested in the article) for momentum and valuation. (Each quintile has roughly 20% of the total market cap.) Here is the result: (click to enlarge) Low valuations are at the right, high at the left. Low momentum at the top, high momentum at the bottom. Ideally, by this method, you would look for industries in the southeast corner. To me, Agriculture, Information Technology, Security, Waste, Some Retail, and Some Transportation look interesting. One in the far southeast that is not so interesting for me is P&C Insurance. Yes, it has done well, and compared to other industries, it is cheap. But industry surplus has grown significantly, leading to more competition, and sagging premium rates. Probably not a great time to make new commitments there. Anyway, the above table should print out nicely on two sheets of letter-sized paper. Not that it would be a substitute for your own due diligence, but perhaps it could start a few ideas going. All for now. Disclosure: None.

Treasury Yields Have Me Shying Away From Buying Some More Dominion Resources

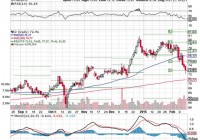
Summary The stock appears to be fairly valued on next year’s earnings estimates. Increasing treasury yields has people investors leaving safe-haven yields plays such as Dominion. The company at least pays a great dividend to help stem the losses on the capital side of things. Dominion Resources (NYSE: D ) is a producer and transporter of energy. It manages its daily operations through three operating segments namely Dominion Virginia Power of DVP, Dominion Energy and Dominion Generation. On February 6, 2015, the company reported fourth quarter earnings of $0.84 per share, which beat the consensus of analysts’ estimates by $0.01. In the past year, the company’s stock is up 2.53% and is losing to the S&P 500, which has gained 14.03% in the same time frame. Since initiating my position in the growth portfolio back on December 23, 2014, I’m down 4%. I’d like to take a moment to evaluate the stock to see if right now is a good time to purchase more for the growth portfolio. Fundamentals The company currently trades at a trailing 12-month P/E ratio of 28.37, which is fairly priced, but I mainly like to purchase a stock based on where the company is going in the future as opposed to what it has done in the past. On that note, the 1-year forward-looking P/E ratio of 18.66 is currently fairly priced for the future in terms of the right here, right now. The 1-year PEG ratio (5.52), which measures the ratio of the price you’re currently paying for the trailing 12-month earnings on the stock while dividing it by the earnings growth of the company for a specified amount of time (I like looking at a 1-year horizon), tells me that the company is expensively priced based on a 1-year EPS growth rate of 5.14%. Financials On a financial basis, the things I look for are the dividend payouts, return on assets, equity and investment. The company pays a dividend of 3.55% with a payout ratio of 101% of trailing 12-month earnings while sporting return on assets, equity and investment values of 2.9%, 12.9% and 7%, respectively, which are all respectable values. Because I believe the market may get a bit choppy here and would like a safety play, I believe the 3.55% yield of this company is good enough alone for me to take shelter in for the time being. The company has been increasing its dividends for the past 11 years at a 5-year dividend growth rate of 6.5%. Technicals (click to enlarge) Looking first at the relative strength index chart [RSI] at the top, I see the stock approaching oversold territory with a current value of 36.65. I will look at the moving average convergence-divergence [MACD] chart next. I see that the black line is below the red line with the divergence bars decreasing in height which tells me bearish momentum may continue in the name. As for the stock price itself ($72.91), I’m looking at $74.85 to act as resistance and the 200-day simple moving average (currently $70.77) to act as support for a risk/reward ratio which plays out to be -2.94% to 2.66%. Wrap Up After taking a look at the stock I think I’ve determined this is not a good place to be buying more of the stock right now. Fundamentally I believe the company to be fairly valued on next year’s earnings estimates and expensive on future earnings growth. Financially, the dividend is great and doesn’t have a lot of room to grow. On a technical basis the risk/reward ratio shows me there is more risk than reward right now. With interest rates on the ten-year treasury beginning to climb these utility names have begun to take a hit. So I’d first like to see the utility stocks decouple first from the treasury yields before I buy some more of this particular name. Disclaimer: This article is in no way a recommendation to buy or sell any stock mentioned. This article is meant to serve as a journal for myself as to the rationale of why I bought/sold this stock when I look back on it in the future. These are only my personal opinions and you should do your own homework. Only you are responsible for what you trade and happy investing! Disclosure: The author is long D. (More…) The author wrote this article themselves, and it expresses their own opinions. The author is not receiving compensation for it (other than from Seeking Alpha). The author has no business relationship with any company whose stock is mentioned in this article.