Tag Archives: seeking

HEDJ: Is There Any More Upside In This Euro-Hedged ETF?
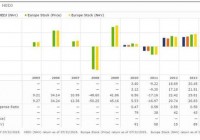
Summary The euro hit a 10-year low relative to the dollar and depreciated dramatically by 22% over a 12 month period leading into April of 2015. As the recent resistance and ostensible capitulation in the euro has taken hold investors may be better positioned in a long non-hedged European position. Since the sharp fall in the euro has subsided over the past four months, the two currencies appear to be normalizing against each other. Resistance has been seen at $1.05 (EU/USD) and the disparity between the two currencies has been retracing towards this level. Over the past 4 months a significant performance divergence exemplifies this phenomenon between hedged (HEDJ) and non-hedged (VGK) European ETFs. Introduction: In my previously published articles (on April 6th 2015: ” The Inevitable Capitulation Of The Euro Hedge ” and on May 20th 2015: ” The Inevitable Capitulation Of The Euro Hedge has begun “), I posited rotating money out of the WisdomTree Europe Hedged Equity (NYSEARCA: HEDJ ) ETF into a long non-hedged European equity position such as the Vanguard FTSE Europe ETF (NYSEARCA: VGK ). This thesis was rooted in three major pillars: 1) The Euro had depreciated relative to the dollar by more than 20% leading into April of 2015. 2) The currency disparity rendered a 10-year low for the euro relative to the dollar. 3) The Euro hedge within HEDJ had been largely attributable to this outperformance over an 18 month time period through April of 2015 relative its indices. Now four months later, two additional attributes may further support this thesis: 1) The Greece crisis is behind us and while this situation was not factored in to my previous articles as a potential event, this fiasco did not negatively impact the euro beyond the $1.05 resistance level. 2) As a looming interest rate increase by the Federal Reserve is on the horizon, this inevitable event may be priced in to some extent and thus the impact on the currency discrepancy may not be as dramatic as previously thought. This partial priced in event will mitigate the downside effect of the euro relative to the dollar when an interest rate increase takes place. Investors in the WisdomTree Europe Hedged Equity ETF have been rewarded handsomely over the past year leading into April of 2015 as the euro has depreciated relative to the dollar in spectacular fashion by more than 20% through March of 2015. HEDJ possess a hedge component exploiting this currency difference on the side of the US dollar, thus investors are rewarded as the euro weakens in relation to the dollar. I posited that this hedge may inevitably become a liability as the two currencies normalize against each other and thus back in April it was time to be in the sell camp of this hedged ETF prior to this hedge component working against investors in HEDJ. I suggested, as Europe continues to strengthen throughput 2015 and beyond, investors may be better positioned in a long European holding such as the Vanguard FTSE Europe ETF as opposed to the euro-hedged HEDJ. This article revisits this thesis four months removed to quantitatively assess the recent movement in the dollar and its impact on the performance of the hedged and non-hedged ETFs. The hedge: the depreciating euro relative to the US dollar HEDJ has outperformed its non-hedged index by a wide margin in 2014 and 2015 albeit through March. HEDJ outperformed the Morningstar non-hedged Europe Stock index on an annual basis by 11.3% and 11.9% in 2014 and 2015 (through March), respectively (Figure 1). However that outperformance of 11.9% through March has given up ground and has since fallen to an outperformance spread of 7.6% YTD (Figure 1). Per WisdomTree, HEDJ seeks to provide investors with exposure to European equities with a built-in hedge against the euro while focusing on companies that conduct a significant portion of their business overseas (non-euro exposure). “The Index and Fund are designed to have higher returns than an equivalent non-currency hedged investment when the value of the U.S. dollar is increasing relative to the value of the euro, and lower returns when the U.S. dollar declines against the euro.” This currency hedge has played out well for investors as the euro has slid against the dollar over the previous 12 months through March of 2015 (Figure 2). The euro sat at a 10-year low against the dollar with a sharp 22% depreciation seen over the previous 12 months heading into April of 2015 (Figures 2 and 3). A sharp divergence between the two currencies can be seen in figures 2 and 3, demonstrating this 20% slide. From these data, I stated that currency fluctuations are transient over the long-term, thus the euro hedge will likely capitulate in the near term. (click to enlarge) Figure 1 – Morningstar annual performance of HEDJ relative to a non-hedged Morningstar Europe Stock index (click to enlarge) Figure 2 – Google Finance graph showing the euro depreciation relative to the dollar over the previous 12 months leading into April of 2015 (click to enlarge) Figure 3 – Google Finance graph showing the euro depreciation relative to the dollar over the past 10 years heading into April of 2015. The capitulation of the euro hedge may be unfolding Recent data suggests that the perpetual falling of the euro may be coming to an end relative to the dollar (Figure 4). There also appears to be a firm resistance at ~$1.05. The euro touched down twice at or near $1.05 in Mach and April (Figure 4). Given the most bullish case for the dollar, some analysts are projecting the dollar to hit $0.95 by the end of the year. Assuming that the dollar hits that mark, this translates into another ~9% move after the already 22% move. Investors may be safe remaining in the hedge for now without much upside given the most bullish case. Given the most bullish estimates, I’d be content capturing over 70% of that spread and rotating money out of that position into a long European position such as VGK if investors would like to maintain exposure to European equities. (click to enlarge) Figure 4 – Google finance YTD performance of the euro relative to the dollar Hedge verses non-hedge performance: HEDJ and VGK Taking a close look at a long European ETF position via VGK (which I wrote about in detail here ) in comparison to the euro hedged HEDJ over the long-term exemplifies that currency fluctuations are transient over the long-term and this euro hedge will likely continue to capitulate in the near term. In 2012 and 2013 HEDJ underperformed VGK on an annual basis at times when the euro and dollar were mostly stable relative to each other (Figure 5). This hedge play has been highly favorable for investors over the most recent 12 month time period through March of 2015 however the currencies will inevitably start to trend to the inverse of this hedge as recent data suggests. At the point of initial reversion to the mean, this hedge will essentially be rendered useless and VGK will outperform as it did in 2012 and 2013. As the euro depreciation seems to have been arrested, HEDJ will likely continue its capitulation and underperform with any further uptick in the euro. This has been the case over the past four months, where VGK has outperformed HEDJ by 3.0% (Figure 6). These data suggest that VGK may be superior moving into the future and combined with the recovery in Europe, it may be time to abandon HEDJ and be long European equities without the euro hedge prior to the hedge working against the investor. (click to enlarge) Figure 5 – Morningstar annual return comparison between HEDJ and VGK through March of 2015 (click to enlarge) Figure 6 – Performance divergence between VGK and HEDJ over the previous four months since my initial article Conclusion: HEDJ has outperformed the non-hedged Morningstar Europe Stock index on an annual basis in 2014 by 11.3% and 11.9% through March in 2015. It is noteworthy to point out that this 11.9% outperformance has dwindled down to a 7.6% outperformance YTD. Specifically regarding HEDJ vs VGK, HEDJ maintains an outperformance of 11%, down from 14.3% since my last article in April. The hedge against the euro within HEDJ is largely attributable to this outperformance over the 12 month time period through March. Considering that the euro appears to have capitulated from its 10-year low preceded by a sharp depreciation by more than 20% indicates that this hedge may have played out. Continued exposure to this hedge may inevitably become more of a liability as the two currencies normalize against each other and thus it may be time to take profits. As Europe continues to strengthen throughput 2015 and beyond, investors may be better positioned in a long European ETF such as VGK. If the European economic strength is enough to mitigate the dollar rise after the Federal Reserve increases rates then there’s limited upside to remaining in this hedge. In terms of quality attributes, HEDJ lacks adequate diversification (by design) and provides a dividend yield inferior to that of VGK and the expense ratio is 6 times that of VGK (0.58%). Taken together, this euro hedge has provided investors with great returns however data suggest currency fluctuations are transient over the long-term and this euro hedge may not add any additional value to one’s portfolio moving into the future. Disclosure: The author currently holds shares of VGK and is long VGK. The author does not hold shares of HEDJ. The author has no business relationship with any companies mentioned in this article. I am not a professional financial advisor or tax professional. I am an individual investor who analyzes investment strategies and disseminates my analyses. I encourage all investors to conduct their own research and due diligence. Please feel free to comment and provide feedback. I value all responses. Disclosure: I am/we are long VGK. (More…) I wrote this article myself, and it expresses my own opinions. I am not receiving compensation for it (other than from Seeking Alpha). I have no business relationship with any company whose stock is mentioned in this article.

The O’Shares FTSE U.S. Quality Dividend ETF: You’re Dead To Me

Summary Mr. Wonderful Kevin O’Leary recently launched a dividend focused ETF. OUSA is a smart beta ETF with screening parameters focused on Quality, Value, and Yield. Is there merit in this fund, or should Kevin go take a hike? As a frequent watcher of Shark Tank, I was intrigued to find out that dirty-rich Kevin O’Leary, self anointed “Mr. Wonderful,” had developed a dividend ETF, the O’Shares FTSE U.S. Quality Dividend ETF (NYSEARCA: OUSA ). The fund is less than a month old, with onset of trading July 14. I wanted to determine if there was merit to the fund, or whether O’Leary is just throwing chum into the water to attract some attention. Kevin O’Leary OUSA’s online materials state that the fund is correlated to the FTSE U.S. Qual/Vol/5% Capped Factor Index, which focuses on “Quality, Low Volatility, and Dividend Yield.” OUSA’s tearsheet refers us to the FTSE web site for additional information relative to how index constituent are selected and weighted within the portfolio. There one can read all about the ground rules as well as a methodology overview . There is also a fact sheet summary available, for those interested in statistical gibberish. I was unable to find a complete list of current constituents. Portfolio The fund (as of July 14) is invested in 142 companies, both large- and mid-cap, with weighted average market cap of $152 billion. The average dividend yield is 3.2 percent. Here is a list of top 10 holdings as disseminated on July 14, complete with the common misspelling of Proct”o”r and Gamble: (click to enlarge) Images sourced from Oshares.com There was also a breakdown of industry exposure: (click to enlarge) Let’s compare the holdings to the SPDR S&P 500 Trust ETF (NYSEARCA: SPY ) ….and sector weightings…. Source: spdrs.com OUSA vs. SPY The funds share 6 of their top 10 holdings with one another. The main difference is in concentration. OUSA concentrates 38% of assets in the top 10 while SPY has about 17% of assets in the top 10. O’Leary’s fund is considered “smart beta” since it screens on basis of “Quality, Value, & Yield.” SPY is a plain passive index that we generally know the constituents of at all times. And while there is sector diversification, I don’t think I would characterize OUSA’s as “index hugging” in nature. For instance, SPY contains 17% exposure to financials. Presumably, according to graphs above, OUSA has less than 4% exposure. Generally when ETFs have somewhat similar allocations, the trump card could be the fee. Currently SPY charges .0945% annually while OUSA’s net expense is .48%, with a waiver in place until July of 2018. Since O’Leary is advertising a 3.2% yield on the underlying holdings, we can probably guess that it will actually pay out somewhere between 2.5 and 2.7% on a full year run rate. SPY sits somewhere around 2.1 percent. Let’s Make A Deal! If I were able to switch positions and grill O’Leary like he does the entrepreneurs that stand in front of his majesty, I’d hit him hard on the fee, because like him, I’m not overpaying and want good ROI. I’d inquire as to what makes this FTSE methodology so superior to a passive index like SPY. He’d probably respond that investors should only own stocks that pay dividends, which his fund does. About 1 in 5 S&P 500 stocks don’t. He’d probably also bring up the point that his fund concentrates in quality and low volatility, providing opportunity to not only realize a yield in excess of SPY, but perhaps total return as well. Plus one could also sleep better at night with OUSA than SPY. Maybe he’d have a point. Since I wouldn’t characterize this fund as index hugging in nature, maybe it has a good shot of providing portfolio alpha. But I’d remind him 75% of active fund managers can’t beat an index. Further, OUSA has no track record of success and doesn’t appear to be pulling in assets by the boatload as of yet. Perusing the top 10 holdings once again, I’d remind him that many of them have really stunk up the joint ( Exxon Mobil Corporation (NYSE: XOM ), Chevron Corporation (NYSE: CVX ), The Procter & Gamble Company ( PG), Apple Inc. ( AAPL)) over the less than a month the fund has been public. Of course he’d then remind me that the fund hasn’t fared any worse than SPY over the same time – which is basically true. But, I tell him I’d want a better deal to be a buyer. “You’re no better than SPY,” I’d tell him. Then I’d tell Mr. Wonderful to drop his fee, at which point he’d say, “You’re no better than an Italian hit man, Aloisi” and turn down the offer. As he turns his back to me I’d utter, “O’Leary, you and your OUSA are dead to me!” Disclosure: I am/we are long AAPL,XOM. (More…) I wrote this article myself, and it expresses my own opinions. I am not receiving compensation for it (other than from Seeking Alpha). I have no business relationship with any company whose stock is mentioned in this article. Additional disclosure: Disclaimer: The above should not be considered or construed as individualized or specific investment advice. Do your own research and consult a professional, if necessary, before making investment decisions.

Diversification Is Not Sufficient

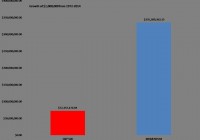
Strategy diversification may be superior to traditional methods. Momentum and trend following could provide protection during down markets. We demonstrate a simple system that can be replicated using low cost index funds. In a follow up to our recent article, Value Based Asset Allocation , we wanted to introduce you to our method for diversification. Unlike financial theory, we do not believe that diversification is sufficient for shielding a portfolio against large declines. Our view is that strategy diversification goes a long way to properly diversify a traditional asset allocation, especially during periods of market stress. Momentum is simply using price to determine the appropriate allocation. Price works as the ultimate indicator because of supply and demand. The irrefutable law of supply and demand has been the ultimate guide to navigating markets for centuries. Supply and demand governs how prices move. Therefore, price tells the true story. For example, if there are more buyers than sellers, prices will rise. If there are more sellers than buyers, prices will fall (Dorsey, 2007). Understanding what force is governing the market is critical to making allocation decisions. If supply is in control, you will want to avoid that market. On the other hand, you will want to invest in a market where demand is the stronger force. Momentum investing, by our definition, is allowing price to determine the investment allocation. It is about maintaining a harmonious relationship with the market. The idea is that the market is the sum total of all the investment experience and expertise of the market participants. The collective knowledge of the group is, in theory, superior to the individual’s over the long term. It is better to exist within a synchronous association rather than in opposition. As John Maynard Keynes suggested, “The market can stay irrational longer than you can remain solvent.” According to a trend follower, “Mr. Market” is always right, no matter how seemingly irrational. Momentum strategies have delivered superior performance to buy and hold investing (Berger, Israel and Moskowitz, 2009) . Meb Faber used a simple moving-average system to allocate to the S&P 500 or cash, demonstrating that he could reduce the correlation of his strategy to the S&P 500 in down markets to -0.38 and maintain a positive correlation of 0.83 during positive years (Faber & Richardson, 2009) . The implications of this study are profound. They indicate that by using a simple trend-following system, one can create a strategy to reduce correlation to equities when most other correlations are rising. When correlations rise during periods of market uncertainty, portfolio risk increases. Faber provides a simple solution to this particular conundrum despite using the S&P 500 as the investment vehicle. Momentum and trend following are strategies used to diversify a portfolio and cut market risk through the avoidance of large slumps. We use momentum in order to take advantage of positive herd mentality and avoid negative herd mentality. We alternate between risk-on and risk-off, dependent on the price trend of stocks and bonds. Capitalizing on the short term and herd mentality allows the investor to gain access to a return stream that does not always move in tandem with stocks and bonds. For example, during the time period from 2007 to 2009, the stock market (S&P 500) collapsed over 55 percent. Many managed-futures managers or commodity-trading advisors (CTAS) showed positive returns. Managed-futures managers are largely trend followers. Consequently, the managed-futures traders were negatively correlated with stocks and provided the ultimate diversification to a traditional portfolio. The time period from 2007 to 2009 is not unique. During several other market declines and reductions in traditional asset classes, trend-following traders demonstrated the ability to take advantage of the scrambling herd and capture impressive gains. Trend following seems high risk to many investors who still look at risk as volatility. Many momentum systems actually have higher volatility than the market. The fact is that volatility is not risk, and “the acceptance of higher risk in a trend-following investment can actually lower the risk of your stock and bond portfolios because when trend following zigs, typical stock and bond investments zag.” (M.W. Covel, 2009) Trend following appears to be an elixir for the behavioral ills of investing. Herd mentality, overconfidence, representativeness, anchoring effects, and loss aversion are all dealt with through systematic trend following, or momentum investing. We can use a simple system with indexes to replicate a strategy that protects during market declines without sacrificing the upside. In our strategy we use indices (baskets of securities tracking a particular market) to gain exposure because of their relatively low costs and high transparency. To illustrate the effectiveness of trend following historically, we are going to provide a simple, rules-based system as an example. The rules are as follows: Rank the S&P 500, Russell 2000, and the US 10-Year Treasury bond based on the three-month performance. Pick the strongest index based on the ranking. Run the ranking system each month. The important information to gather from the historical results is the performance of the momentum strategy during the years when the market declines. The ability to rotate away from the stock market when the price deteriorates allows for better performance when trouble is present. The core tenet of trend following and momentum investing is the protection of capital. Hence, the momentum strategy demonstrates the most significant outperformance during periods in which the overall stock market is experiencing large declines. The strategy performs well during positive stock market environments as well. The portfolio can be invested in the stock market when the trend is positive and stocks are stronger than bonds. In other words, the simple momentum system acts as a risk reducer during the down markets without sacrificing profits during up markets. The momentum strategy has done well compared to the S&P 500 since 1972. In the chart below, we illustrate the results to better demonstrate the benefits of incorporating trend following. If you had invested $1 million in the S&P 500 in the beginning of 1972, your investment would have grown to over $72 million by the end of 2014. If you had invested your $1 million during the same period using our momentum strategy, it would have grown to over $335 million. That is significant outperformance. Remember that the model can only maximize returns up to what the market earns. The outperformance comes from avoiding the down markets. (click to enlarge) The momentum system does not avoid declines. Since the end of 1971, there have been nine years in which the S&P 500 declined. Over the past forty years, the momentum strategy declined seven times. The beauty of momentum strategy lies in avoiding the big declines. The strategy never suffered a loss of greater than 7 percent in any given year. In comparison, the market suffered five declines over 10 percent, of which three were over 20 percent. Investors have to minimize the big declines to succeed when investing. The momentum system is able to accomplish the task of protecting the investors during big market declines, helping the portfolio grow more over the long term. As we have outlined above, momentum has historically worked to participate in up markets and protect against deep market declines. While we cannot predict the future trajectory of prices, we know that markets will fluctuate, and we have designed portfolios to potentially take advantage of market volatility. Trend-following traders have demonstrated their ability to navigate the uncertain markets and capitalize on turmoil. Trend following is not only reserved for the Wall Street elite or the ultra-rich. You can apply the same principles to diversify your portfolio using simple index funds and at a fraction of the cost of paying a manager. Disclosure: I/we have no positions in any stocks mentioned, and no plans to initiate any positions within the next 72 hours. (More…) I wrote this article myself, and it expresses my own opinions. I am not receiving compensation for it. I have no business relationship with any company whose stock is mentioned in this article. Additional disclosure: HYPOTHETICAL PERFORMANCE RESULTS HAVE MANY INHERENT LIMITATIONS. NO REPRESENTATION IS BEING MADE THAT ANY ACCOUNT WILL OR IS LIKELY TO ACHIEVE PROFITS OR LOSSES SIMILAR TO THOSE SHOWN. IN FACT, THERE ARE FREQUENTLY SHARP DIFFERENCES BETWEEN HYPOTHETICAL PERFORMANCE RESULTS AND THE ACTUAL RESULTS SUBSEQUENTLY ACHIEVED BY ANY PARTICULAR TRADING PROGRAM. PAST RESULTS DO NOT GUARANTEE FUTURE RETURNS. HYPOTHETICAL PERFORMANCE FOR ILLUSTRATION PURPOSES ONLY.