Tag Archives: seeking

Stocks And ETFs To Reflect Top Sales Growth

The Q2 earnings season is now about to end with 83.1% of the S&P 500 companies having reported already. The overall picture was not quite bright as growth for both earnings and revenues was negative in the quarter. Earnings fell 2.4% year over year while weakness in revenues was more acute with a 4.1% annual rate of decline (as per the Zacks Earning Trends issued on August, 2015). Companies found it hard to even match the already conservative top-line estimates. When everything points toward utter sluggishness, investors must be looking for specific stocks or sectors that somehow managed to outperform, snapping the downing trend. Though the entire season is all about earnings, how about looking at sales more precisely? After all, sales are harder to influence in an income statement than earnings. A company can end up scoring decent earnings by adopting cost-cutting or refinancing its credit facility which in turn lowers interest expenses. But investors should note that these activities do not represent the companies’ prime purpose – sales generation. So, it appears more analytical to assess through a company’s sales per share rather than earnings per share. This is truer given the fact that it is harder for a company to shape up revenue figures by some other measure. MarketWatch recently highlighted 10 S&P 500 companies that exhibited the speediest sales growth in the last reported quarter. To do so, the author calculated sales per share of the latest quarter and then measured its rate of growth from the sales per share in the year-ago quarter. While this approach surely presents investors a set of stocks to keep a close eye on, they can also consider the ETF or basket approach for risk minimization purpose. For that, we highlight ETFs considerably invested in those stocks. Housing D.R. Horton (NYSE: DHI ) , one of the biggest and well-known homebuilders in the nation, topped the list provided by MarketWatch having recorded 37% growth in sales per share. This Zacks Rank #2 (Buy) stock has Growth and Momentum Style Score of ‘A’. On the other hand, Lennar Corporation (NYSE: LEN ) a Zacks Rank #1 (Strong Buy) firm in the Residential Construction space, recorded 30% sales per share growth in its most recent quarter and occupied the sixth spot. Both stocks have considerable exposure of at least 11% in the iShares U.S. Home Construction ETF (NYSEARCA: ITB ) . Another housing ETF SPDR Homebuilders ETF (NYSEARCA: XHB ) also invests over 3% in each stock. In any case, the housing sector shaped up well in recent months. The Key constituents’ sturdy sales performance makes these funds worth noting. Both funds have a Zacks ETF Rank #3 (Hold). Health Care Who does not know about the robust health of the health care stocks and funds? Merger and acquisition frenzy, encouraging industry fundamentals and promising new drugs sent the sector on cloud nine these days. Quite expectedly, stocks from health care sectors will hit the list of ‘fastest sales growth’. The Zacks Rank #1 Gilead Sciences (NASDAQ: GILD ) put up 36% sales growth. The stock, with Growth and Value Style Scores of ‘B’ has hefty shares in the Market Vectors Biotech ETF (NYSEARCA: BBH ) and the iShares Nasdaq Biotechnology ETF (NASDAQ: IBB ) with about 16% and 8%, respectively. Though biotech stocks and ETFs recently fell out of investors’ favor possibly on overvaluation concerns, the space should bounce back after the correction. BBH has a Zacks ETF Rank #1 while IBB carries a Zacks ETF Rank #2. Technology Though the tech sector was on a roller-coaster ride this earnings season and some major tech companies were badly beaten down post earnings, much of the downside was largely the result of lofty expectations. At least for the tech monster Apple (NASDAQ: AAPL ) , the scenario looked like this. The company had some issues with some of its key products and their sales momentum, but still saw sales per share growth of 36%. This Zacks Rank #2 (Buy) stock has compelling indicators of Growth and Value scores of ‘A’ and Momentum score of ‘B’. Investors can easily play this stock via the iShares Dow Jones US Technology ETF (NYSEARCA: IYW ) , the Technology Select Sector SPDR ETF (NYSEARCA: XLK ) and the Vanguard Information Technology ETF (NYSEARCA: VGT ) . All three are Buy rated. Link to the original post on Zacks.com
Canaries In The Investment Mine Have Stopped Serenading

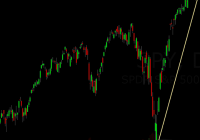
In an effort to boost the U.S. economy, the central bank of the United States has used higher stock prices as a weapon of perceived wealth creation. Here’s the downside. When you implicitly and explicitly suggest that rates will remain lower for longer, people begin to count on risky assets being safer than they are. With all four of the classic canaries unable to serenade, the historical probability of a sharp correction for the broader U.S. market increases significantly. Eleven months ago, I talked about four classic canaries in the investment mines: (1) commodities, (2) high yield bonds, (3) small-cap stocks, (4) emerging market stocks. I explained that when all four of those canaries stop singing, riskier ETFs tend to break down. Indeed, in September of 2014, commodities were tanking, high-yield bonds were plunging, small-cap stocks were faltering and emerging market stocks were plummeting. The canaries were losing their voices. Not surprisingly, the broader U.S. markets eventually followed suit in rather dramatic fashion. In fact, everyone’s favorite large-cap benchmark (S&P 500) had nearly pulled back 10% from a record high. Then came the 16th of October. Stocks had coughed up yet another 1% through mid-day. With the broad-market benchmark pushing the 10% correction level, the president of the St. Louis Fed, James Bullard, suggested that his colleagues at the U.S. Federal Reserve could always rethink the use of additional bond buying with an extension of quantitative easing (QE). And at that time, Bullard talked about worldwide economic uncertainty being a reason for continuing “QE3.” Here’s what happened next: Today, the “Bullard Bounce” still reverberates off the walls and ceilings of the New York Stock Exchange. Why? Investors believe the Fed is willing to do whatever it takes to preserve higher stock prices. Keep in mind, in an effort to boost the U.S. economy, the central bank of the United States has used higher stock prices as a weapon of perceived wealth creation. When you pressure investors to take on risks that they would not normally have taken by pushing interest rates to ‘rarely-before-seen’ lows – and when you entice consumers to finance gratification through credit rather than through savings – asset prices rise precipitously. Higher home prices and higher stock prices make people feel wealthier. Here’s the downside. When you implicitly and explicitly suggest that rates will remain lower for longer, people begin to count on risky assets being safer than they are; similarly, the size of debts can become some so large that those who trusted the policy makers lose the ability to service the debt (let alone pay it back) when borrowing costs go up. Now let us tie together last year’s four classic canaries with the subsequent Bullard bounce and today’s financial markets. The PowerShares DB Commodity Index Tracking ETF (NYSEARCA: DBC ) has accelerated its decline since July and currently seeks depths that haven’t been seen since the heart of the Great Recession. That’s one canary that cannot sing. Meanwhile, high yield bonds via the SPDR Barclays Capital High Yield Bond ETF (NYSEARCA: JNK ) is accelerating its decline that began in June. Canary #2 has a bone its throat. Circumstances are not much better for small-cap stocks and emerging market stocks. The iShares Russell 2000 ETF (NYSEARCA: IWM ) sports a P/E of 20.6 according to Morningstar. It has fallen 6.3% from its late June pinnacle and sits slightly below its long-term 200-day moving average. In another words, Canary Numero 3 is having difficulty vocalizing. The Vanguard FTSE Emerging Markets ETF (NYSEARCA: VWO ) may provide value-du-jour with is P/E of 14, yet China’s recent currency devaluation and Russia’s oil price losses make it difficult for investors to see a forest for the trees. After all, VWO is sitting near 52-week lows and has been in a steep downtrend since May. (The fourth of the four canaries isn’t singing.) With all four of the classic canaries unable to serenade, the historical probability of a sharp correction for the broader U.S. market increases significantly. What’s more, just like the September-October pullback of 2014, market internals have been deteriorating at a noteworthy pace, whether one is looking at waning breadth of bullish stock participation or widening credit spreads between investment grade and higher yielding corporates/junk corporates. It follows that a sell-off not unlike the one that occurred in September-October of 2014 is extremely likely to transpire here in 2015. However, there are several differences this time around. For one thing, revenues have declined for two consecutive quarters, making valuations even more questionable than in 2014. In a similar vein, earnings have gone flat. Historically, stocks tend to fade when corporations are less capable of producing top-line and bottom-line results (as opposed to merely beating the analyst estimates). What’s more, this time around, there’s less certainty of the Federal Reserve defending stocks at the 10% correction level. Granted, Bullard employed a “do whatever it takes” strategy to send stocks skyrocketing last year by bringing up global economic uncertainty. It would be extremely easy for the Fed to use an excuse that economic weakness in Europe, Asia, Australia, Latin America – pretty much everywhere – requires that they tighten at a sloth’s pace. For example, they raise rates at one-eight of a point rather than one-quarter, or they execute a one-n-done quarter-point for 3-6 months. That would likely encourage risk assets to get back on track. Nevertheless, until there is clarity on Fed policy, all of the signs point to “risk-off” outperforming “risk-on.” Downside risks remain elevated until the Federal Reserve shines light on its game plan going forward. Even if the path for tightening is described as ultra-slow and measured, investors will need to weigh just how much the higher costs of borrowing might adversely impact the cost of debt servicing for corporations; that is, we may see further erosion of profitability from an earnings picture that is already flat. People, companies as well as countries tend to forget that debt is still debt. If the overall cost of servicing debt is lowered through rate games, and the debts are increased because families/corporations/nations are taking the worm on the fish hook, it does not mean that the hook itself won’t cause severe damage or death. Again, non-financial corporations are more leveraged at 37% than they were in 2007 at 34%. Higher borrowing costs from the U.S. Federal Reserve? That’s going to be more than an inconvenient challenge. Disclosure: Gary Gordon, MS, CFP is the president of Pacific Park Financial, Inc., a Registered Investment Adviser with the SEC. Gary Gordon, Pacific Park Financial, Inc, and/or its clients may hold positions in the ETFs, mutual funds, and/or any investment asset mentioned above. The commentary does not constitute individualized investment advice. The opinions offered herein are not personalized recommendations to buy, sell or hold securities. At times, issuers of exchange-traded products compensate Pacific Park Financial, Inc. or its subsidiaries for advertising at the ETF Expert web site. ETF Expert content is created independently of any advertising relationships.

A Well Designed High Yield Bond Fund: HYG

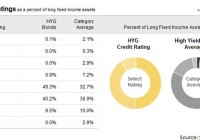
Summary The IShares iBoxx $ High Yield Corporate Bond ETF has the expected credit risk for a high yield fund, but the yield is worth it. The holdings show reasonable diversification in the debt securities in the portfolio. Maturities are scattered from 1 year through 10 years with the heaviest levels in the 5 to 7 year range. The correlation to SPY which causes the ETF to dip with the S&P 500 is a concern of investing in junk bond funds. The correlation issues should be less pronounced if investors include other (not junk, lower yield) bond funds in their portfolio. The iShares iBoxx $ High Yield Corporate Bond ETF (NYSEARCA: HYG ) is a solid bond fund for exposure to securities rated BB or B. As I’ve been searching for appealing bond funds, finding great ETFs for bonds of mediocre quality and higher yields has been difficult. After looking through the portfolio, I think the holdings are fairly reasonable for an investor wanting to regularly keep part of their portfolio in a bond fund. The holdings clearly don’t have impeccable credit ratings but they do offer investors a decent yield. The distribution yield is about 5.5% which means investors are actually getting some respectable income out a bond fund. Credit Quality When the name says “High Yield Corporate Bond”, investors should know that is going to mean that credit ratings won’t be very high. The allocation here seems within reason even if it is a little heavier on the specific ratings it targets than the category average. See the chart below: (click to enlarge) The concentration doesn’t bother me. If I’m going to invest in a credit sensitive bond portfolio I want the holdings to be diversified when considering the issuer of the debt, however having a heavy focus on the specific credit ratings is nice when an investor wants to build an entire portfolio and use multiple bond funds. Holdings I prepared the following chart showing the largest debt holdings of HYG. There were a couple equity holdings showing up but they were inconsequential to the overall portfolio as their combined value was significantly less than 1% of the portfolio. (click to enlarge) Maturities I grabbed another chart to show the maturity ranges across the portfolio: (click to enlarge) The maturity profile for the iShares iBoxx $ High Yield Corporate Bond ETF is fairly reasonable for an investor trying to get a solid diversification across the yield curve with a preference for shorter to medium length securities which should reduce the volatility of the portfolio. Of course, the credit risk on the portfolio could be an issue for some investors and may influence volatility in its own way. Regardless, the portfolio is showing almost no exposure beyond 10 years while having a solid yield. When it comes to maturities, I think this breakdown looks fairly solid. Risk HYG has been around since early 2007 which is wonderful for seeing how the fund did during that challenging period that followed. The shares did drop hard along with the market, which is not surprising given that they are investing in high yield (and thus higher risk) securities, however it did not fall even remotely as hard as the S&P 500. The biggest risk factor from a portfolio standpoint that came up for me was a 73.8% correlation in monthly returns with the S&P 500. Since one purpose of the bond portion of the portfolio is to provide diversification, it is a strike against junk bond funds that they tend to move with the market. That is a problem that should be impacting most junk bonds though, not a risk unique to HYG. Expense Ratio The one thing I really don’t care for is the expense ratio at .50%. I’m not going to say that this is terrible for a bond fund, but my expectations for low expense ratios are not met. Conclusion HYG is a fairly solid option for junk bond exposure. The portfolio appears to be designed well, the distribution of maturities works to help avoid excessive exposure to a single part of the yield curve and the portfolio produces a respectable amount of income. I could go for a lower expense ratio to really make this fund stand out, but that is the only weakness I see that is specific to the fund. If an investor is looking at the role of the bond fund in their portfolio, it would be wise to consider having multiple bond funds if the first one is going to be investing in junk bonds. This kind of fund can offer some diversification benefits to investors but it would be most productive in a portfolio that combines it with a few other bond funds with different duration exposures and higher credit ratings to enhance the diversification benefits that bonds bring to the investor’s portfolio. Disclosure: I/we have no positions in any stocks mentioned, and no plans to initiate any positions within the next 72 hours. (More…) I wrote this article myself, and it expresses my own opinions. I am not receiving compensation for it (other than from Seeking Alpha). I have no business relationship with any company whose stock is mentioned in this article. Additional disclosure: Information in this article represents the opinion of the analyst. All statements are represented as opinions, rather than facts, and should not be construed as advice to buy or sell a security. Ratings of “outperform” and “underperform” reflect the analyst’s estimation of a divergence between the market value for a security and the price that would be appropriate given the potential for risks and returns relative to other securities. The analyst does not know your particular objectives for returns or constraints upon investing. All investors are encouraged to do their own research before making any investment decision. Information is regularly obtained from Yahoo Finance, Google Finance, and SEC Database. If Yahoo, Google, or the SEC database contained faulty or old information it could be incorporated into my analysis.