Tag Archives: seeking

Short-Term Respite For Gold ETFs?

After being crushed in the last three months thanks to a stronger dollar and lower demand, gold saw some respite yesterday on a dovish Fed stance. Gold rallied the most in three months, suggesting strong sentiment in the space, at least for the short term. Gold started off 2015 on a strong note thanks to its safe-haven appeal as doubts over Greece’s fate in the Euro zone and the looming quantitative easing in that debt-ridden region were widespread. However, all returns soon turned into losses as the U.S. economy kept coming up with sturdy data especially on the jobs and housing front which made the case for a sooner-than-expected rate hike stronger. The SPDR Gold Trust ETF (NYSEARCA: GLD ) lost about 6.5% in the last three months while the Market Vectors Gold Miners ETF (NYSEARCA: GDX ) was off about 25%. However, yesterday, GLD added over 1.3% while GDX was up about 2.9%. GDX saw more gains as it often trades as a leveraged play on gold? What Brightens the Yellow Metal? Muted Prospect of September Fed Liftoff: Yesterday’s move was largely the result of speculations of no imminent rate hike decision by the Fed. Minutes from the U.S. Federal Reserve’s July meeting weakened the heightened prospect for Fed rate liftoff in mid September. Some market participants shifted the timeline of a lift-off to December. This in turn weighed on the greenback. The Fed now looks for further stabilization in the labor market and wants to wait for inflation to reach its target. While job data in the U.S. appears strong, apart from the wage gains, low inflation seems to be the real culprit. Inflation is still short of the Fed’s longer-term target due to the free fall in energy prices last year and declining prices of non-energy related imports, per the Fed minute. The Fed expects the price index to remain under pressure in the near term though it will perk up in the medium term. Notably, U.S. consumer prices grew 0.1% in July, down from 0.3% and 0.4% recorded in the prior two months. All these bolstered the appeal for gold. Fight to Safety on China Currency Issue: In early August, Chinese policymakers devalued the country’s currency by 2% against the greenback to boost its waning export profile. Global experts apprehended a currency war in the near future, especially among the Asian export-centric biggies. As s result, yuan devaluation instigated a rout across the global asset classes and spurred a flight to safety for a valid reason. Gold is long viewed as a safe asset and gained an edge over the other assets thanks to this currency issue. Compelling Valuation: Finally, the metal scored higher on a low valuation, compelling investors to trend back into this space, building positions in this otherwise risky metal. GLD is presently trading at a 15% lower level than its 52-week high price prompting many to take advantage of this sudden surge in gold. Bottom Line Having said this, we would like to note that the Fed is due for policy tightening sometime this year. In fact, a group of analysts is still voting for a September lift-off. Inflation will not be barrier for long, and will put pressure on gold yet again. So, this gain seems a short-lived one and will better suit investors with a short-term approach. After all, GLD has a negative weighted alpha of 11.57 , hinting at more pain. Link to the original article here .

How I Dodged A -69.3% Bullet With A Checklist And 3 Important Lessons To Take Away

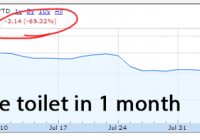
Summary SFX Entertainment has terminated their going private bid. The warnings signs that made me stay away. An updated checklist to avoid these types of situations. Phew. By learning from past mistakes, sticking with experience and following solid advice from books and gurus, it all helped me dodge a -69.3% bullet. Here’s what I mean. At the end of June, I wrote about a special situation involving SFX Entertainment (NASDAQ: SFXE ) where the founder was aiming to take his company private. And here’s what happened. (It was just announced that the deal has now been terminated dropping a further 20% making it -74.6% as of today.) The spread when I first looked at it was at 14%. A spread greater than 10% shows that the market doesn’t fully trust the deal. I know from a few painful experiences where I focused too much on the upside and bit off a big position, only to see the deal get canceled at the last moment. The deal for SFX Entertainment hasn’t been canceled. However, the go shop period has been extended, the buyout offer is to likely to be lowered and the company doesn’t provide enough information to investors. The special committee and its advisors will entertain offers for the entire Company as well as assets not central to the Company’s core business through at least October 2, 2015. Sillerman has agreed to cooperate with the special committee to obtain the best available offer for the Company’s shareholders. The October 2 date was chosen to allow potential bidders and their financing sources to have visibility into the Company’s performance during its peak festival season, thus providing a full and accurate picture of the Company’s results and prospects. To facilitate potential offers during this period, all “no-shop” restrictions and the related breakup fees provisions applicable to the Company under the merger agreement will no longer apply, enabling potential bidders to freely evaluate the Company in light of the recent substantial decline in its share price. Any new transaction will be evidenced by a new definitive agreement as the existing merger agreement is no longer effective. – Source No wonder it’s down so much in a little more than a month. They don’t all end up like this though. There have been plenty of going private acquisitions with a wide spread that went through successfully. Buffett has said that missing out on opportunities was been one of his biggest mistakes. If that’s the case, then dodging blowups like this is a huge success. But how? Simple. Using a checklist like this saved my bacon. Make sure both parties have done their due diligence – Pass Financing and regulator approval is complete – Pass (now a Fail) Get preliminary shareholder sentiment or controlling shareholder approval – Uncertain Obtain regulator (SEC, FCC, any and all) approval – N/A Get final shareholder approval at a meeting called for that purpose – TBD Check to see that insiders are continually vesting or buying shares – Pass On the surface, there are more passes than fails for SFXE, but because the importance increases as I move down the checklist. Number 6 was the big hold up. Without a clear green light by all shareholders, management and the special committee, it’s risky to put money down. Additional Criteria to be Added to the Checklist Based on the events that took place, I’m adding a couple of new checks to my checklist. Is management trustworthy? Is the upside and downside risk asymmetric? Is Management Trustworthy? There are plenty of managers that execute like a surgeon. But with SFXE, there are warning flags visible in the way the company is managed and how it communicates to investors. Plus, when a CEO publicly flips the bird and grabs his crotch , I tend to lose trust in their actions and judgment. Management should also have a history of doing what they say. There are a lot of managers who are showman types. After all, they are the face of the company and it is their job to sell, sell, sell. A method to check this is by comparing a few annual letters. Go through and highlight what they say they will do, and check the following letters to see whether it was accomplished, or whether it shows up in the numbers. The numbers won’t lie. Is the Upside Downside Risk Asymmetric? Special situations operate on a timeline, usually within a year. Due to a short time frame, the tradeoff is that your profit potential is small. So it makes it even more important to go after the high certainty opportunities and ignore the ones with bad odds. It’s a lot safer and easier to go after a very highly certain 1-2% return in a month using a large amount of money, compared to using a small amount of money for the 10% uncertain ones. When Google (NASDAQ: GOOG ) (NASDAQ: GOOGL ) announced in 2912 that it was buying Motorola Mobility, the spread was a little under 2% at the time. I put down a large amount of cash to maximize my returns over a very short period in order to make up for the small profit potential. Keep doing this with the good ones and you’ll build up your returns. Buffett didn’t achieve 30% annually during his prime by simply assigning a massive portion of this portfolio to Coca Cola (NYSE: KO ) and American Express (NYSE: AXP ) and then sitting on it. No. He spent a lot of his time on special situations and other active areas to increase his returns one brick at a time. The Updated Special Situations Checklist OK. Adding the two new checks, here’s the updated checklist I’ll be using for special situations going forward. Make sure both parties have done their due diligence Check management of both parties are trustworthy (NEW) Financing and regulator approval is complete Get preliminary shareholder sentiment or controlling shareholder approval Obtain regulator (SEC, FCC, any and all) approval Get final shareholder approval at a meeting called for that purpose Check to see that insiders are continually vesting or buying shares Verify upside and downside risk is asymmetric by assigning potential upside to downside returns (NEW) 3 Important Lessons to Take Away This year, it seems like I’m parroting the same thing, but the lessons I got from SFXE is clear. 1. It’s more important to focus on protecting the downside I didn’t like the 14% upside versus 24% downside. Seeing the stock price now, you can see how the downside turned out to be larger. 2. Don’t get greedy Even if you did go long SFXE, if you kept it to a small position, less than 1% of your portfolio, it didn’t damage your returns or portfolio compoundability. Losing money is bad because it makes it harder for your money to work because you’re chopping it off at its knees. I said earlier that I put a large amount into the Motorola merger, but that was because it was a highly certain transaction with very little possibility of failure. But I didn’t sell my other positions to free up cash to go all in. I used what was available and didn’t put in more than what made sense. 3. Manage risk The best investors and traders have one thing in common. They are obsessed with minimizing risk by going after asymmetric bets and taking advantage of inefficiencies. This may sound similar to points 1 and 2, but managing risk involves position sizing, seeing how things fit in your portfolio, being emotionless, not falling for obvious behavioral fallacies, being able to cut losses, admitting faults and more. But for the purpose of this article, adjust your sizing based on the odds and don’t overdo it. Disclosure: I/we have no positions in any stocks mentioned, and no plans to initiate any positions within the next 72 hours. (More…) I wrote this article myself, and it expresses my own opinions. I am not receiving compensation for it. I have no business relationship with any company whose stock is mentioned in this article.
Today’s Strong Competitive Wealth-Builder ETF Investment: IYG

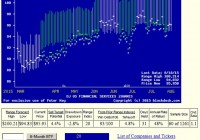
Summary From a population of some 350 actively-traded, substantial, and growing ETFs this is a currently attractive addition to a portfolio whose principal objective is wealth accumulation by active investing. We daily evaluate future near-term price gain prospects for quality, market-seasoned ETFs, based on the expectations of market-makers [MMs], drawing on their insights from client order-flows. The analysis of our subject ETF’s price prospects is reinforced by parallel MM forecasts for each of the ETF’s ten largest holdings. Qualitative appraisals of the forecasts are derived from how well the MMs have foreseen subsequent price behaviors following prior forecasts similar to today’s. Size of prospective gains, odds of winning transactions, worst-case price drawdowns, and marketability measures are all taken into account. Today’s most attractive ETF Is the iShares US Financial Services ETF (NYSEARCA: IYG ) . The investment seeks to track the investment results of an index composed of U.S. equities in the financial services sector. The fund generally invests at least 90% of its assets in securities of the underlying index and in depositary receipts representing securities of the underlying index. It seeks to track the investment results of the Dow Jones U.S. Financial Services Index (the “underlying index”), which measures the performance of the financial services sector of the U.S. equity market. It is a subset of the Dow Jones U.S. Financials Index. The fund is non-diversified. (from Yahoo.Finance.ETF.Profile) The fund currently holds assets of $774 million and has had a YTD price return of +5.49%. Its average daily trading volume of 107,208 produces a complete asset turnover calculation in 75 days at its current price of $95.95. Behavioral analysis of market-maker hedging actions while providing market liquidity for volume block trades in the ETF by interested major investment funds has produced the recent past (6 month) daily history of implied price range forecasts pictured in Figure 1. Figure 1 (used with permission) The vertical lines of Figure 1 are a visual history of forward-looking expectations of coming prices for the subject ETF. They are NOT a backward-in-time look at actual daily price ranges, but the heavy dot in each range is the ending market quote of the day the forecast was made. What is important in the picture is the balance of upside prospects in comparison to downside concerns. That ratio is expressed in the Range Index [RI], whose number tells what percentage of the whole range lies below the then current price. Today’s Range Index is used to evaluate how well prior forecasts of similar RIs for this ETF have previously worked out. The size of that historic sample is given near the right-hand end of the data line below the picture. The current RI’s size in relation to all available RIs of the past 5 years is indicated in the small blue thumbnail distribution at the bottom of Figure 1. The first items in the data line are current information: The current high and low of the forecast range, and the percent change from the market quote to the top of the range, as a sell target. The Range Index is of the current forecast. Other items of data are all derived from the history of prior forecasts. They stem from applying a T ime- E fficient R isk M anagement D iscipline to hypothetical holdings initiated by the MM forecasts. That discipline requires a next-day closing price cost position be held no longer than 63 market days (3 months) unless first encountered by a market close equal to or above the sell target. The net payoffs are the cumulative average simple percent gains of all such forecast positions, including losses. Days held are average market rather than calendar days held in the sample positions. Drawdown exposure indicates the typical worst-case price experience during those holding periods. Win odds tells what percentage proportion of the sample recovered from the drawdowns to produce a gain. The cred(ibility) ratio compares the sell target prospect with the historic net payoff experiences. Figure 2 provides a longer-time perspective by drawing a once-a week look from the Figure 1 source forecasts, back over two years. Figure 2 (used with permission) What does this ETF hold, causing such price expectations? Figure 3 is a list of securities held by the subject ETF, indicating its concentration in the top ten largest holdings, and their percentage of the ETF’s total value. Figure 3 Source: Yahoo Finance IYG Concentrates 60% of its assets in its top ten commitments. This provides a responsive measure of the action of market prices of stocks in this essential sector. The major holdings are all established, dominant participants in the financial services industry. Figure 4 is a table of data lines similar to that contained in Figure 1, for each of the top ten holdings of IYG. For convenience, the IYG data itself is included. Figure 4 (click to enlarge) Column (5) contains the upside price change forecasts between current market prices (4) and the upper limit of prices (2), regarded by MMs as being worth paying for protection from adverse price change. The average of +7.2% of the top ten IYG holdings is well above the market-average proxy of SPY of +5.3%. Diversification of IYG’s other 40% of holdings damps its overall upside (as MMs see it) to only +4.4%. But in the same stroke the risk side of the equation in (6) for IYG is brought down to worst-case price drawdowns of -2.8%, below the defensive market-tracking ETF SPY norm of -3.2%. In an environment many consider imbued with high market risk, IYG may provide a very attractive balance. The ability of IYG holdings to recover from those worst-case drawdowns and achieve profits (8) occurred in 93% of experiences. The equity population only recovered less than two thirds of the time, and while the SPY experiences were more consistent, the achieved gains were much smaller. SPY has had only +3.5% gains previously from like forecasts of +5.3%. Another qualitative consideration is the credibility of IYG after previous forecasts like today’s. Its net average price change gain (column 9) has been 1.1 times the size of the upside forecast average, +4.8% compared to +4.4%. The equity population’s actual price gain achievement, net of losses has been a pitiful +3.2% compared to promises of 13.5%. Conclusion IYG provides attractive forecast price gains, supported by its equally appealing largest holdings. Both the ETF and many of its major holdings offer very attractive prospects in near-term price behaviors, demonstrated by previous experiences following prior similar forecasts by market makers. But it may be considered a defensive commitment in the face of widespread anticipation of further market weakness. A more constructive strategy would be to seek out individual stock opportunities offering odds-on achievement of low double-digit price gains where past similar forecasts encountered only small worst-case price drawdowns during their relatively short holding periods en route to sell targets. The blue summary row of Figure 3 labeled “20 best odds forecasts” tells what the current top-ranked wealth-building opportunities are offering, as a comparative competitive norm. YTD in 2015, 2062 of these 20-a-day list members have reached closeouts in an average of 2-month holding periods, providing a +30% annual rate of average price-change gains. Disclosure: I/we have no positions in any stocks mentioned, and no plans to initiate any positions within the next 72 hours. (More…) I wrote this article myself, and it expresses my own opinions. I am not receiving compensation for it (other than from Seeking Alpha). I have no business relationship with any company whose stock is mentioned in this article.