Tag Archives: seeking-alpha

Ceasefire In Ukraine And The Oil Price Recovery: A Trend Reversal For The Russian Share Market

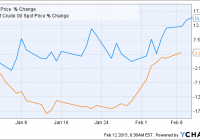
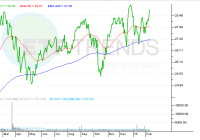
Summary If the cease-fire holds the political situation should start to calm down and the sanctions will be canceled or they will be let to expire. The technical analysis shows that the bottom was reached during December and January and now a major trend reversal should be coming. Most of the Russian companies are significantly undervalued, their P/E ratios should move higher after the political risk eases. The biggest threat is the oil price right now. If it starts to collapse again, the Russian share market rally will be only short-lived. It was reported by the news agencies that the leaders of Russia and Ukraine agreed on a cease-fire that should begin on February 15. It is a really good news for the whole region, assuming that the cease-fire will hold this time. It can represent a significant catalyst for the Russian share market. The Market Vectors Russia ETF (NYSEARCA: RSX ) is 15% higher year-to-date. Most of the gains were achieved during the last two weeks when the oil price started to recover. A prolonged oil price recovery along with a calm down of the political situation may lead to a significant recovery of the undervalued Russian shares. The Russian share market represented by RSX is down by more than 35% over the last 12 months. The main reasons are the oil price collapse, the political tensions between Russia, the western countries and Ukraine and the sanctions against Russia. If the mess around Ukraine is cleaned up, two of the three factors should be at least partially eliminated. From technical point of view it seems like the bottom was reached in the middle of December at $13.36. The share price is 26% higher now. The RSI reached the level of 15 back then but it has recovered very quickly. It is over 58 today and it keeps on growing. Also the moving averages start to signal a major trend reversal when we can expect that the 20-day SMA will surpass the 50-day SMA any day now. The table below shows the estimated P/E ratios of the 10 biggest RSX holdings. The weights are dated January 29, 2015 and the P/E ratios are dated February 12, 2015. As we can see most of the companies have a significant upside potential when we compare their P/E ratios to the P/E ratios of their foreign peers. It is hard to expect that the Russian P/E ratios will match the P/E ratios of the U.S. or European companies due to an increased political risk, but we can expect that the difference will decrease significantly after the political situation around Ukraine calms down. company weight in RSX (29.1.2015) estimated P/E (12/2014) Lukoil ( OTC:LUKFY ) 8.65% 4.6749 Gazprom ( OTCQX:GZPFY ) 7.43% 3.1890 Magnit 6.19% 20.911 Norilsk Nickel ( OTCPK:NILSY ) 6.08% 8.8119 Novatek 5.54% 13.8094 Sberbank ( OTCPK:SBRCY ) 5.32% 4.9904 Tatneft ( OTCPK:OAOFY ) 5.00% 5.4344 VTB Bank 4.96% 34.7950 Mobile TeleSystems (NYSE: MBT ) 4.31% 8.6266 Surgutneftegaz ( OTCPK:SGTPY ) 4.30% 2.1068 Source: own processing using data of Yahoo Finance and Bloomberg Conclusion The bet on the Russian market is still a risky one but the fundamental as well as technical factors start to indicate that it may start to pay off. If both Ukraine and the rebels will observe the cease-fire, the political situation should start to calm down and the sanctions against Russia will be canceled or they will be just let to expire. The technical indicators signalize a major trend reversal as well. The biggest threat is the oil price right now. If the oil price keeps on growing or if it at least doesn’t retest its recent lows, the recovery of the Russian share market should be quite quick. Disclosure: The author has no positions in any stocks mentioned, but may initiate a long position in RSX over the next 72 hours. (More…) The author wrote this article themselves, and it expresses their own opinions. The author is not receiving compensation for it (other than from Seeking Alpha). The author has no business relationship with any company whose stock is mentioned in this article. Are you Bullish or Bearish on ? Bullish Bearish Neutral Results for ( ) Thanks for sharing your thoughts. Submit & View Results Skip to results » Share this article with a colleague

SKYY: Tech ETF Investors Look Up To The Cloud

Summary Investors are turning to the cloud computing space. Focus on the First Trust ISE Cloud Computing Index fund. Cloud computing explained and industry overview. Investors are piling into the cloud computing industry and sector-related exchange-traded funds to capture a quickly growing segment of the digital age. The First Trust ISE Cloud Computing Index ETF (NasdaqGM: SKYY ) , which tracks a modified equally weighted index of companies engaged in the business activity of supporting or utilizing cloud computing services, now has $408.5 million in assets under management. SKYY has seen its AUM burgeon twofold over the past year, attracting $214.9 million in net inflows since January 2014, according to ETF.com data. Cloud computing refers to a mode of accessing digital information from the internet through web-based tools and applications, instead of directly connecting to a server. The desired data and software packages are stored in servers where a consumer can access them from anywhere as long as one has access to the internet. Investors are anticipating a significant shift in technology, as old packaged and desktop software are pushed aside, while consumers and businesses shift into simpler web- and mobile phone-based services, reports Ari Levy for CNBC . The global cloud computing market is expected to expand 30% per year and hit $270 billion by 2020. SKYY breaks down its component holdings into several sub-sectors. Pure play cloud computing companies are comprised of direct service providers for the cloud, which include network hardware/software, storage and cloud computing services. Non-pure play cloud computing companies are those that provide goods and services in support of the cloud computing space. And lastly, are the technology conglomerate cloud computing companies that directly utilize or support the use of cloud computing. SKYY includes one of the largest tilts toward Netflix (NASDAQGS: NFLX ) at 4.4% of the ETF’s underlying portfolio, along with other companies that utilize cloud computing services, like Amazon (NASDAQGS: AMZN ) at 3.9%. The broad ETF, which includes 39 companies involved with cloud computing, provides a diversified way for investors to access the sector, as valuing individual companies could be unorthodox. While the cloud computing space has attracted more investment dollars, observers are unsure how to properly value the companies For example, of the 26 index members to recently go public, 21 are losing money on generally accepted accounting principle basis, with a combined $388.7 million in the red last quarter – many of the companies opt to incur large expenditures upfront and amortize costs later through revenue streams. Consequently, traditional price-to-earnings ratios may not properly reflect valuations. Instead, most of these cloud computing-related business models rely on churn and retention – it takes about a year for a customer to become profitable due to costs of sales and market, so the companies rely on renewal rates, which is why subscriber rates are so important for companies like Netflix as witnessed in its last earnings report. First Trust ISE Cloud Computing Index Fund (click to enlarge) Disclosure: The author is long AMZN. (More…) The author wrote this article themselves, and it expresses their own opinions. The author is not receiving compensation for it. The author has no business relationship with any company whose stock is mentioned in this article.

EOI Vs. EOS: Not Much Difference Between These CEFs

Summary On the surface, the biggest difference between Eaton Vance’s EOI and EOS appears to be the Roman numeral in EOS’ name. There are, really, more differences when you dig a little bit deeper. In the end, however, the differences aren’t big enough. Eaton Vance has a collection of closed-end funds, or CEFs, that have confusingly similar names. I recently wrote about Eaton Vance Tax-Managed Buy-Write Opportunities Fund (NYSE: ETV ) and Eaton Vance Tax-Managed Buy-Write Income Fund (NYSE: ETB ). The difference between these two funds boils down to the word ” opportunities .” With Eaton Vance Enhanced Equity Income Fund (NYSE: EOI ) and Eaton Vance Enhanced Equity Income Fund II (NYSE: EOS ), there’s even less of a hint at what the difference might be. The same… Other than the names of EOI and EOS being differentiated by little more than a single Roman numeral, there are other confusing similarities that you’ll need to wade through. For example, word for word, the two funds’ objectives are: “The Fund’s primary investment objective is to provide current income, with a secondary objective of capital appreciation.” In fact, the marketing material for each fund provides identical “fund highlights,” as well: The Fund invests in a portfolio of primarily large- and midcap securities that the investment adviser believes have above-average growth and financial strength and writes call options on individual securities to generate current earnings from the option premium. The Fund pays monthly distributions to shareholders pursuant to a managed distribution plan. Meanwhile, they both IPOed within a three month span between late 2004 and early 2005. It looks like Eaton Vance used copy and paste when it introduced these two funds. …But different So, on some level, these two CEFs are very similar offerings. In fact, the managers on EOI are also on EOS, though there are two additional managers rounding out the crew on EOS. And even when you look at the two portfolios, similarities remain. For example, Apple (NASDAQ: AAPL ), Google (NASDAQ: GOOG ) (NASDAQ: GOOGL ), Amazon (NASDAQ: AMZN ), and Microsoft (NASDAQ: MSFT ), taken as a group, account for well over 10% of each fund. And both portfolios have options written on around 45% of their portfolios. But there’s an important distinction between the two funds that starts to show up when you look more closely at the top holdings and more broadly at the overall portfolio. For example, although the four technology stocks above are all heavily represented in the top ten of each portfolio, they are, in fact, weighted differently. Why? Likely because EOI is benchmarked against the S&P 500 Index while EOS is benchmarked against the Russell 1000 Growth Index. So, for example, at the end of 2014, EOI had materially more exposure to financials at 16% of the portfolio versus 6% for EOS. And EOS had more exposure to technology at 31% versus 21% for EOI. There are a couple of other notable differences within the sector exposure, too. That said, both ETFs seem to stay fairly close to their benchmarks, shifting their weightings at the edges rather than making big sector bets. (Vastly different from the situation at ETV and ETB.) Notably, however, they also have roughly similar standard deviations over the trailing decade. That’s not overly surprising since both track close to their broadly-diversified indexes, but it means there’s not much of a risk uptick with either one. Performance wise, EOS has slightly outperformed EOI over the trailing 10 years according to Morningstar, turning in an annualized total return based on net asset value through January of roughly 6.8% versus EOI’s annualized return of 6%. Note that Morningstar’s figures include the reinvestment of dividends. On the income score, EOS and EOI both yield around 7.8% based on their market prices, according to the Closed-End Fund Association. Their discounts are also fairly close and in line with their historical averages. Which one? If I had to pick between just these two funds, I’d probably go with Eaton Vance Enhanced Equity Income Fund II, but only because of the slightly better long-term performance. That said, if you are on the hunt for a fund that tracks the S&P 500, EOS is a bad choice because that isn’t what it’s meant to do. For that, EOI is the right option. Neither, however, is a bad fund. In fact, each of their long-term performances compare quite favorably to Morningstar’s Large Growth category. So, in the end, the big difference is the indexes that EOS and EOI follow. That, however, may not mean all that much to you. And if that’s the case, they are close enough cousins that they almost look like twins. Disclosure: The author is long AAPL. (More…) The author wrote this article themselves, and it expresses their own opinions. The author is not receiving compensation for it (other than from Seeking Alpha). The author has no business relationship with any company whose stock is mentioned in this article.