Tag Archives: seeking-alpha

Malaysia: Truly A Bear Market

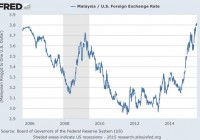
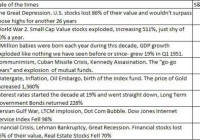
The Trend Is Your Friend for the Malaysia’s stock market and currency. Sell the iShares MSCI Malaysia ETF on worsening economic fundamentals, worsening technicals and worsening sentiment. The looming unwind of the global carry trade and a relatively pricey valuation for EWM means a further 20% drop in price by year end is highly likely. Malaysia is in big trouble. Its currency and stock markets are in bear markets with no sign things getting better any time soon. First of all, the country has weak economic fundamentals. Analysis by the Malaysian Institute of Economic Research, dated 4h August 2015, shows that the important indicators of consumer confidence, retail trade, employment and residential property are all pointing to weaker economic growth conditions. Then there is the country’s deteriorating terms of trade situation. In 2014 commodity exports accounted for 26% of exports and 18% of GDP. With palm oil, crude and refined products and natural gas, Malaysia’s key export commodities all heading lower, this is putting pressure on Malaysia’s fiscal situation. But don’t lower commodity prices hit many emerging markets? Yes, but in actual fact Malaysia is the only country within the Association of South East Asian Nations region that does not benefit from lower oil prices. This means that Bank Negara the country’s central banks will likely need to ease, weakening the ringgit further. This would be a bad development for the iShares MSCI Malaysia ETF (NYSEARCA: EWM ). The ringgit which is at ten year lows and broke though the key technical level of 3.7 ringgits to the dollar is in a strong bear market and monetary policy divergence is set to make the currency weaker. (click to enlarge) Although a weaker currency could help exports in theory, Malaysia has little room for credit expansion to spur domestic consumption and investment. According to the IMF Malaysia’s debt to GDP stands at 165% – one of the highest of all emerging market countries. This means the ” monetary transmission mechanism ” by which lower policy rates should help economic conditions may not be very effective. With EWM dropping from its 52 week high $16.32 to below $12, hasn’t the market already priced in a lot of these negative factors in already? I don’t think so – with a trailing P/E ratio of 16 times, the market is not cheap. Additionally, Malaysian stocks are highly susceptible to a de-rating once the Fed raises interest rates and fast money investors with their global carry trades accelerate their unwinding of risky asset holdings. That’s because as funding costs creep up for carry trades, the risk return of carry trades in Emerging Markets looks increasingly less favorable, and with fast money investors all conscious of the positioning of other like-minded investors it’s likely that they will be inching nearer to the exit door in order to get out first. This situation and a potential rush to sell could lead to a self-fulfilling prophecy in so many of the higher risk and especially commodity linked markets like Malaysia. For EWM the $12 mark was also a key technical level, as it has been both a support and resistance level several times since 2007 – see chart below. The next key technical level appears to be $10. (click to enlarge) Furthermore, global investors have no doubt been troubled by the ongoing scandal in Malaysian politics concerning the Prime Minister Najib Razak’s personal finances. At a time when Japan is steadily improving its corporate governance, other Asian countries need to do everything to keep up on this front because unlike Japan, countries like Malaysia are unable to implement quantitative easing without spurring massive inflation. The key risk to my thesis is if oil prices were to rally hard or if the policy divergence between the Fed tightening and Bank Negara’s likely easing were to turn around. These two scenarios would alleviate the economic fundamentals somewhat and support a market valuation of 16 times earnings in my view. However, I view this outcome as very low probability. The bottom line is Malaysia is a falling knife. There is no catalyst on the horizon which suggests attempting to pick a bottom could be successful. Investors with the ability to short, should short EWM. Long only investors who want exposure to Asia can find better alternatives. Disclosure: I/we have no positions in any stocks mentioned, but may initiate a short position in EWM over the next 72 hours. (More…) I wrote this article myself, and it expresses my own opinions. I am not receiving compensation for it (other than from Seeking Alpha). I have no business relationship with any company whose stock is mentioned in this article.

Normal Doesn’t Exist

By Andy Hyer Michael Batnick on “waiting for normal:” These are not normal times investors are living in. The Fed has held short-term interest rates at zero for six years now, a policy experiment never seen before. This has many investors eager to see what happens if and when this returns to “normal.” One of the biggest psychological challenges of investing is that there is always something out of the norm. Take a look at the table below which highlights different times investors had to live through and the extreme performances that accompanied them. I wonder at what point would somebody would have described the times as normal. Next, have a look at the chart below, which shows the S&P 500 return by decade. You’ll notice absolutely no pattern. Understanding how different it always is should be a great reminder why no strategy will work in all market environments. Knowing the limitations to what you are doing- whatever you’re doing- is critical. The ability to stick with your plan during the bad times will determine if you’ll be around for the good ones. So what is an investor to do? I see a couple options: Employ some form of static asset allocation and hope for the best. 25% fixed income, 25% US equity, 25% international equity, and 25% alternatives, and rebalance annually. Employ some type of forecasting to try to be opportunistic in asset class exposure Employ some form of trend-following tactical approach to asset allocation The static allocation approach may ultimately perform okay over long periods of time, but will investors have the risk tolerance to continue with long stretches of an asset class being out of favor / going through severe drawdowns? Maybe. Maybe not. Chances are the forecasting approach will end very badly, as forecasting usually does. The third option makes much more sense to me. Simply systematically deal with trends as they unfold. This is the approach we use with our Global Macro separately managed account, which happens to be our most popular SMA strategy. Thank goodness we gave ourselves as much flexibility as we did with the way that this portfolio is constructed, because this decade has been entirely different from the last one. As one example, consider how well commodities performed in the last decade, compared to the trainwreck that they have been so far this decade. Normal doesn’t exist. A disciplined way to be flexible is the key to successfully navigating the ever-changing financial landscape. The relative strength strategy is NOT a guarantee. There may be times where all investments and strategies are unfavorable and depreciate in value. Share this article with a colleague

Why Countercyclical Indexing Makes Sense

I am totally convinced that low fee indexing is the best way to allocate one’s savings (in fact, my entire company is based around this view). But when it comes to allocating that savings in a specific manner there are virtually limitless options. We know that reducing your frictions is the only way to guarantee higher returns, so it’s imperative that we be tax and fee efficient in our portfolios. But that doesn’t solve the allocation decision, which will ultimately steer our returns . It’s increasingly common for indexers to advocate a market cap weighted methodology. This is the typical “passive” indexing approach. In essence, you buy what the market generates and you never accuse the market of being wrong. So, if you wanted to be a true passive indexer today you’d buy the market cap weighting of global stocks and bonds at roughly 45/55 stocks/bonds and rebalance back to that weighting every year. You don’t deviate from this because the market is always “right” and you just want to take the market return. Easy enough.* But my economic and financial research shows something strange. This “efficient market” view of the system isn’t always right. In fact, investors and economic agents appear to make substantial errors at times. For instance, I calculated the average retail investor’s relative total net asset allocation over the last 30 years and found that retail investors, by being procyclical, are almost always positioned in the exact wrong way during the business cycle: You can see what happens here. Investors chase stocks in bull markets and they sell them into bear markets. And by doing so they end up being underweight stocks early in the market cycle and overweight stocks late in the market cycle when they’re riskiest. This is in addition to the fact that we know that most individual investors perform poorly due to very high cash balances. The most interesting part about this is that doing the opposite of this allocation (inverting the stock/bond allocation) actually generated similar nominal returns as the market cap weighting (8.2% per year vs. 8.9% per year), but improved the risk adjusted returns by a significant margin (standard deviation of 6.4 vs. 13.8). In other words, betting against the procyclical market cap weighting actually generated a better overall return. Most importantly, what this does is better align an indexer’s profile with their exposure to various asset classes over the course of the market cycle. And the beauty is, you can do this in a highly tax and fee efficient manner if you have the patience to actually let the approach play out over time. Of course, you can tweak this sort of an approach in numerous ways. That’s the essence of my approach at Orcam. But the findings are interesting – countercyclical indexing might actually be a superior approach to market cap weighted procyclical indexing. In other words, discretionary deviations from market cap weighting might not be as silly as some indexers portray. * It should be noted that even a static allocation that rebalances is always rebalancing back to imbalanced degrees of risk during the market cycle. That is, a 60/40 is actually a much riskier portfolio late in the market cycle than it is early in the market cycle. This leaves the investor who buys the 60/40 in 2009 owning a much less risky portfolio than the investor who buys a 60/40 in 2007.