Best Performing Franklin Templeton Mutual Funds Of Q2 2015
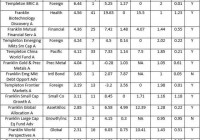
Franklin Resources, Inc. a global investment management organization known as Franklin Templeton Investments, reported fiscal third-quarter 2015 earnings of 82 cents per share which missed the Zacks Consensus Estimate by 5 cents. Moreover, the results compared unfavorably with the prior-year quarter earnings of 92 cents per share. Franklin Templeton is a leader in asset management with a presence in over 150 countries. As for the mutual funds, Franklin Templeton mutual funds put up a decent performance in a relatively tough second quarter. While markets found it difficult to post strong gains, the best gain coming from a Franklin Templeton mutual fund hit 6.5%. The best gain for a Franklin Templeton mutual fund lagged Fidelity’s best gain of 11.6% , scored by Fidelity China Region Fund (MUTF: FHKCX ). However, top gainer Templeton BRIC Fund (MUTF: TABRX ) did well to beat key peers like BlackRock (NYSE: BLK ), Vanguard and edged past the 6.2% gains for both American Funds and T. Rowe Price. Nonetheless, Of the 331 Franklin Templeton mutual funds under the study, 104 funds finished in the green. The average gain for these funds was nearly 1.7%. This also beats the average gains for the key peers. Of the funds finishing in the green in the second quarter, BlackRock, Vanguard, American Funds had average gains of 1.3%, 0.8% and 1.4%. Meanwhile, T. Rowe Price (NASDAQ: TROW ) funds ending in positive territory had break even return. In fact, Vanguard had a dismal second quarter and the best gain reached just 3.8%. Coming back to Franklin Templeton funds, the average loss for the 227 funds was 1.4%. Key Takeaways from Second Quarter In its U.S. Economic and Market Overview for Q2, Franklin Templeton has listed 4 key points. These are as follows: Although signs of U.S. economic reacceleration multiplied this spring, broad U.S. equity market indexes ended the second quarter of 2015 on a somewhat muted note. Global “easy money” stimulus measures expanded during the first half of 2015 nearly everywhere except in the United States. Consumer spending bounced back convincingly this spring following winter doldrums, aided not only by better weather but also by some signs of better wage growth, which have been supported by solid employment advances. The U.S. factory sector faced headwinds from the impact of the dollar’s rise and a mild contraction in export demand. To elaborate, Franklin Templeton notes that Greece’s debt crisis intensified volatility at the end of the quarter. Markets were also guided by divergent monetary policies in key regions like Europe, Asia and the U.S. U.S. profits dropped to the weakest year-over-year earnings growth in 11 quarters. Stimulus measures increased in most regions except the U.S. Franklin Templeton notes: “Having implemented unprecedented accommodative monetary policies since the financial crisis, Fed policymakers have indicated their intention to raise interest rates later this year if conditions warrant, and they appeared keen to avoid disrupting the country’s subdued economic growth amid weak productivity and the wavering confidence of businesses, consumers and investors”. Wage growth and employment improvements coupled with better weather conditions helped consumer spending rebound in the spring. In mid June, initial claims dropped to the lowest levels since 2007. The Conference Board’s Consumer Confidence Index had jumped over 100 in May. Meanwhile, housing data also came in positive. Top 15 Franklin Templeton Funds of the Second Quarter 2015 Below we present the top 15 Franklin Templeton funds with best returns of Q2 2015: (click to enlarge) Note: The list excludes the same funds with different classes, and institutional funds have been excluded. Funds having minimum initial investment above $5000 have been excluded. Q2 % Rank vs Objective* equals the percentage the fund falls among its peers. Here, 1 being the best and 99 being the worst. The top 15 gainers’ list is a mixture of funds from varied categories. Diversification is prevalent and we have funds from Foreign, Health, Financial, Intl Bond, Small Co,Growth/Inc and Technology. The Foreign category of mutual funds dominated the gains in the second quarter, as well as, the first half. Healthcare category has also been consistent in having strong gains. Financial and Small Growth categories were also featured in the top 10 list of gainers in the second quarter, according to Morningstar data.Funds from Foreign/Global/Pacific categories included Templeton BRIC A, the Templeton Emerging Markets Small Cap Fund (MUTF: TEMMX ), the Templeton China World Fund (MUTF: TCWAX ), the Templeton Frontier Markets Fund (MUTF: TFMAX ), the Templeton Institutional Fund Global Equity Series (MUTF: TGESX ), However, only TGESX carries a Zacks Mutual Fund Rank #2 (Buy) ; whereas TCWAX and TFMAX now hold a Zacks Mutual Fund Rank #5 (Strong Sell), and TABRX and TEMMX carry a Zacks Mutual Fund Rank #4 (Sell). The other funds include the Franklin Biotechnology Discovery Fund (MUTF: FBDIX ) from Health category and the Franklin Mutual Financial Services Fund (MUTF: TFSIX ) from the Financial category. Both of these funds carry a Zacks Mutual Fund Rank #2 (Buy). From the Small cap category, the Franklin Small Cap Growth Fund (MUTF: FSGRX ) and the Templeton Global Smaller Companies Fund (MUTF: TEMGX ) were the gainers. FSGRX holds a Zacks Mutual Fund Rank #4 and TEMGX carry a Zacks Mutual Fund Rank #3 (Hold). A surprise inclusion in the list is the Franklin Gold and Precious Metals Fund (MUTF: FKRCX ) from the Precious Metals category. In the second quarter, the category had dropped 2.3%. FKRCX carries a Zacks Mutual Fund Rank #1 (Strong Buy). The Franklin Large Cap Equity Fund (MUTF: FLCIX ) and the Franklin DynaTech Fund (MUTF: FKDNX ) are the only other funds carrying a Strong Buy rank. Link to the original post on Zacks.com

