Tag Archives: portfolio

Price Stability In An ETF: The Appeal Of Guggenheim Defensive Equity
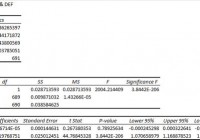
Summary I’m taking a look at DEF as a candidate for inclusion in my ETF portfolio. The only weakness I see is that the ETF has a higher expense ratio as it turns over assets more frequently than I would want. The correlation and standard deviation is very attractive. The data is based on solid liquidity, so feel it is fairly reliable. I’m keeping DEF in the running for my entire portfolio due to the price stability of the ETF. Investors should be seeking to improve their risk adjusted returns. I’m a big fan of using ETFs to achieve the risk adjusted returns relative to the portfolios that a normal investor can generate for themselves after trading costs. I’m working on building a new portfolio and I’m going to be analyzing several of the ETFs that I am considering for my personal portfolio. One of the funds that I’m considering is the Guggenheim Defensive Equity ETF (NYSEARCA: DEF ). I’ll be performing a substantial portion of my analysis along the lines of modern portfolio theory, so my goal is to find ways to minimize costs while achieving diversification to reduce my risk level. What does DEF do? DEF attempts to track the total return (before fees and expenses) of the Sabrient Defensive Equity Index. At least 90% of the assets are invested in funds included in this index. DEF falls under the category of “Large value”. Does DEF provide diversification benefits to a portfolio? Each investor may hold a different portfolio, but I use the SPDR S&P 500 Trust ETF (NYSEARCA: SPY ) as the basis for my analysis. I believe SPY, or another large cap U.S. fund with similar properties, represents the reasonable first step for many investors designing an ETF portfolio. Therefore, I start my diversification analysis by seeing how it works with SPY. I start with an ANOVA table: (click to enlarge) The correlation is 86%. That is a reasonable correlation level under Modern Portfolio Theory. Lower levels of correlation allow more of the risk associated with individual investments to be effectively diversified away. For an ETF that will hold several large U.S. equity securities, that’s a very appealing level of correlation as long as the liquidity is good. Standard deviation of daily returns (dividend adjusted, measured since April 2012) The standard deviation is amazing. For DEF it is .576%. For SPY, it is 0.748% for the same period. SPY usually beats other ETFs in this regard. Because the standard deviation is fairly low and the correlation is pretty good, I’m expecting to see substantial diversification benefits that would make DEF a reasonable fit in most portfolios. Liquidity is moderate Over my sample period the average trading volume was around 35,000 shares per day. Over the last ten days it was over 55,000. Mixing it with SPY I also run comparisons on the standard deviation of daily returns for the portfolio assuming that the portfolio is combined with the S&P 500. For research, I assume daily rebalancing because it dramatically simplifies the math. With a 50/50 weighting in a portfolio holding only SPY and DEF, the standard deviation of daily returns across the entire portfolio is 0.639%. Notice that this is significantly lower than SPY alone. With 80% in SPY and 20% in DEF, the standard deviation of the portfolio would have been .700%. If an investor wanted to use DEF as a supplement to their portfolio, the standard deviation across the portfolio with 95% in SPY and 5% in DEF would have been .735%. Why I use standard deviation of daily returns I don’t believe historical returns have predictive power for future returns, but I do believe historical values for standard deviations of returns relative to other ETFs have some predictive power on future risks and correlations. Yield & Taxes The distribution yield is 2.5%. It’s a reasonable yield for an investor trying to avoid excessive trading costs. A decent distribution yield can help investors avoid feeling a need to open their portfolio up too frequently. Expense Ratio The ETF is posting .66% for a net expense ratio. I want diversification, I want stability, and I don’t want to pay for them. I view expense ratios as a very important part of the long term return picture because I want to hold the ETF for a time period measured in decades. I’m not thrilled with the expense ratio, but it can be tricky to find ETFs with such a low standard deviation of returns and moderate correlation. Market to NAV The ETF is at a .02% premium to NAV currently. Premiums or discounts to NAV can change very quickly so investors should check prior to putting in an order. The ETF is large enough and liquid enough that I would expect the ETF to stay fairly close to NAV. Generally, I don’t trust deviations from NAV and I will have a strong resistance to paying a premium to NAV to enter into a position. I wouldn’t worry about .02%. Largest Holdings The diversification within the ETF may be a substantial part of the lower standard deviation. (click to enlarge) Conclusion This ETF looks like a contender. In the interest of reducing the deviation of returns I find defensive funds appealing as part of a diversified portfolio. The correlation at 86% isn’t too bad and the fund still showed decent returns and holds some of the same companies as SPY while being less volatile. There are some clear diversification benefits here. If an investor was going to hold only SPY or DEF over the next 20 years, I’d expect SPY to end higher. However, the appealing aspect of DEF is that it can reduce the risk of the portfolio. In the context of a more complicated portfolio that is being rebalanced and contains some more volatile ETFs, I like the role of DEF. The average liquidity isn’t too bad. The days with no change in dividend adjusted close is high enough to give me a little concern (18), but there were no days that actually reported 0 trading volumes. Therefore, I think the liquidity is fairly decent and I wouldn’t treat it as a major concern. Having a decent distribution yield doesn’t hurt either in the context of a long term investor. There’s only one area that concerns me. The ETF is posting a fairly high expense ratio relative to the other strong contenders for this space in my portfolio. The portfolio turnover is also very high at 87%. That surprised me a bit. For a defensive ETF, I would expect less shifting in the positions. For comparison, SPY has a turnover ratio of 3%. One strike against the ETF won’t be enough to eliminate it from consideration. I’ll admit that the largest position being Staples makes me scratch my head a little bit, but the position was still under 1.5% so I’d say the diversification is solid and I wouldn’t worry about it. Investors should notice that the ETF does also hold some significant positions in REITs. That doesn’t bother me, but each investor has a different situation. I was expecting to use an ETF dedicated to REITs to increase my exposure in that regard. Disclosure: The author has no positions in any stocks mentioned, and no plans to initiate any positions within the next 72 hours. (More…) The author wrote this article themselves, and it expresses their own opinions. The author is not receiving compensation for it (other than from Seeking Alpha). The author has no business relationship with any company whose stock is mentioned in this article. Additional disclosure: Information in this article represents the opinion of the analyst. All statements are represented as opinions, rather than facts, and should not be construed as advice to buy or sell a security. Ratings of “outperform” and “underperform” reflect the analyst’s estimation of a divergence between the market value for a security and the price that would be appropriate given the potential for risks and returns relative to other securities. The analyst does not know your particular objectives for returns or constraints upon investing. All investors are encouraged to do their own research before making any investment decision. Information is regularly obtained from Yahoo Finance, Google Finance, and SEC Database. If Yahoo, Google, or the SEC database contained faulty or old information it could be incorporated into my analysis. The analyst holds a diversified portfolio including mutual funds or index funds which may include a small long exposure to the stock.
How Rebalancing Can Help Improve Earnings Quality And Lower Multiples

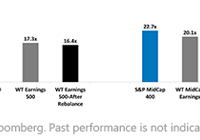
By Jeremy Schwartz A key process driving the WisdomTree earnings-weighted Index approach is a rebalancing process that refreshes constituent weights based on changes in Earnings Stream® and relative value. In earnings-weighted indexes, changes at the rebalance are made based on each stock’s relative price appreciation compared to its relative earnings growth: Companies whose stock prices increased compared to their peers’ while their earnings decreased compared to their peers’ would typically see reduced weight in the WisdomTree Earnings Indexes. In a market cap-weighted index, the only driver of weight is the relative change in market capitalization, which is usually driven by the stock price. Companies whose stock prices fell while their earnings were flat or grew would typically see increased weight in the WisdomTree Earnings Indexes. Companies that have not been profitable on a cumulative basis over the previous four quarters are removed to ensure the continued focus on earnings-generating stocks-one element that improves the quality of the basket by removing more speculative, unprofitable ventures. Weight is also shifted to the relatively more profitable companies and those that have seen highest earnings growth. One way to gauge the impact of the rebalance process is to look at the price-to-earnings (P/E) ratio, essentially the price of the Index divided by its earnings per share before and after the rebalance. Below we show the P/E multiples across market segments. As will be shown, the rebalance can have a large impact on a portfolio’s P/E ratio. U.S. Equity Index Estimated 12-Month P/E Ratios* (as of 11/30/14) (click to enlarge) For definitions of terms and indexes in the chart, visit our glossary . A Lower P/E Ratio Approach: Even prior to the 2014 rebalance, each earnings-weighted Index exhibited a lower P/E ratio than its market capitalization-weighted counterpart. After the rebalance, the P/E ratios dropped even more significantly compared to these benchmarks. This is a key benefit of the annual rebalance process that forces the discipline of reweighting to the fundamental value of the underlying constituents in the Index. Multiples Contracted Anywhere between 7% and 40% across All Indexes: The WisdomTree SmallCap Earnings Index saw multiples contract the greatest at approximately 40%. WisdomTree requires each constituent of its earnings family to demonstrate profitability. This addresses the problem seen in the Russell 2000 Index -namely, a high index-level P/E ratio that is due to index-level earnings being depressed by constituents with negative earnings-by eliminating firms that have had negative earnings over the prior 12 months. Since there are more constituents in small-cap indexes that have delivered negative earnings over the prior 12 months than there are in large-cap indexes, this effect is more pronounced within this size segment. Rebalance Track Record-Consistency in Raising Return on Equity (ROE) Now that we have studied the impact of the rebalance on lowering P/E multiples, we will show the impact of the rebalance in helping to raise the “quality” of the earnings Indexes, measured by the ROE. Post-Rebalance Raising ROE and Improving Quality (click to enlarge) For definitions of terms and indexes in the chart, visit our glossary. This chart illustrates how the rebalance has raised the ROE across four WisdomTree Earnings Indexes. In the 2014 rebalance, for example, the ROE of the WisdomTree SmallCap Earnings Index before and after the rebalance was 7.43% and 11.97%, respectively. As the bull market in equities carries on, it becomes ever more important to pay attention to the underlying valuations and market fundamentals. Above we show how the rebalance both lowered the P/E ratios of each WisdomTree Earnings Index and raised the ROE, a key metric of quality. We believe these are attractive attributes of market exposures, made even more important by the continued gains in the market we have seen in recent years. Important Risks Related to this Article Investments focusing on certain sectors and/or smaller companies increase their vulnerability to any single economic or regulatory development. Jeremy Schwartz, Director of Research As WisdomTree’s Director of Research, Jeremy Schwartz offers timely ideas and timeless wisdom on a bi-monthly basis. Prior to joining WisdomTree, Jeremy was Professor Jeremy Siegel’s head research assistant and helped with the research and writing of Stocks for the Long Run and The Future for Investors. He is also the co-author of the Financial Analysts Journal paper “What Happened to the Original Stocks in the S&P 500?” and the Wall Street Journal article “The Great American Bond Bubble.”

Fidelity Low Priced Stock Fund Is A Value

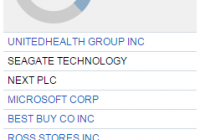
Summary Manager Joel Tillinghast has managed the fund since inception in 1989. He’s racked up an annualized 14% return since inception, versus the less than 10% return of the benchmark. Although it started as a small cap fund, rising assets have forced the fund to increase the average market cap of its holdings. Established in 1989, the Fidelity Low-Priced Stock Fund (MUTF: FLPSX ) was created as a vehicle to invest in out-of-favor small- and mid-cap stocks. The growing assets under management have enabled FLPSX to take on the characteristics of a mid-cap focused value fund while continuing to generate impressive results that still provides investors with high returns. Investing at least 80 percent of net assets primarily in low-priced common stocks, FLPSX seeks to generate returns primarily through capital appreciation. It has done extremely well in the past 15-years, racking up an annualized return of 12.57 percent versus the 4.47 percent return delivered by the S&P 500 Index. That level of market beating performance isn’t as likely due to rising assets, but the fund remains a solid choice for investors. Investment Strategy Joel Tillinghast has managed FLPSX since its inception. Today, he is assisted by a team of six co-managers who are each responsible for approximately 6 percent of the fund. Managers utilize an opportunistic investment approach based on a strict valuation process that predominately targets shares priced below $35 issued by high-quality, small- and mid-sized companies with stable growth prospects. The price per share limitation requires that the managers focus on small-cap stocks with significant growth potential. Generally, the securities should also have a low price-to-earnings (P/E) ratio, generate good cash flow and provide a margin of relative safety. This strategy is based on the belief that many low-priced shares are mispriced by the market and offer the potential for greater returns. They also consider stocks not held in the underlying benchmark index as well as those outside the U.S. to find under-valued, fast-growing companies. On average, one-third of assets are foreign securities. Managers use a long-term, global perspective when selecting individual investments. They identify small- and mid-cap stocks with excellent valuation that are also expected to outperform for many years, allowing the fund to hold securities for the long-term, which is why the fund as a low turnover rate of 12 percent. Tillinghast also hangs on to attractive stocks even if they increase beyond the $35 limit. This causes the funds average market capitalization to drift higher over time. If compelling investment opportunities fail to materialize, the fund will hold a large cash position even if it hampers overall investment returns. Portfolio Composition and Holdings At the end of December 2014, this fund had $44.1 billion in net assets under management. The portfolio held 56.98 percent in domestic equities and 33.4 percent in foreign issues. The foreign sleeve was heavily weighted towards developed markets, mostly Europe and Japan, with a small exposure in emerging markets. The fund also had 0.01 percent bond exposure with the remaining 9.61 percent of assets held in cash. FLPSX’s portfolio has a market cap breakdown of 13 percent giant, 21.27 percent large and 36.56 percent mid, 20.11 percent small and 9 percent micro. This averages out to a median market cap of $5.93 billion, which compares to the category average of $9.7 billion. There were 926 individual holdings within the portfolio at the end of 2014. Managers do not select stocks based on sector exposure, rather sector exposure reflects where they find the best values. At the end of 2014, that left FLPSX overweight (versus the category of mid-cap value) consumer discretionary, information technology and consumer staples, while being underweight financials, healthcare and industrials. The fund’s top 10 individual holdings comprise 25.73 percent of the portfolio. From Fidelity’s website : Several of these holdings highlight the strategy shift and holding stocks even after they cross the $35 threshold. UnitedHealth Group (NYSE: UNH ), for example, currently trades above $100 per share. The fund has a P/E ratio of 13.83 and a price/book ratio of 1.66 along with a dividend yield of 1.91 percent. Historical Performance and Risk The most recent quarterly results were hampered by the fund’s focus on consumer discretionary and information technology as well as its financial holdings and large cash position. Major negative factors included the fund’s exposure to Genworth (NYSE: GNW ), which posted an unexpected third quarter loss, the poor price performance of Microsoft (NASDAQ: MSFT ) and the negative effects of weak holiday sales on British retailer Next. While returns may suffer in the short-term, the investment philosophy of Mr. Tillinghast has produced a 14 percent annualized gain during his 25-year tenure as fund manager. Over this same period, FLPSX has beaten the performance of all its relevant categories and benchmark indices on an impressive risk-adjusted basis. The most recent 1-, 3- and 5-year returns for FLPSX have been 13.58 percent, 15.97 percent and 16.23 percent respectively. This compares to the 15.93 percent, 16.63 percent and 15.96 percent returns of the mid-cap value category over the same periods. The three-year beta and standard deviation for FLPSX are 0.67 and 10.16. FLPSX has Average return and risk ratings from Morningstar. The fund has a trailing 12-month yield of 0.98 percent. Expenses, Fees and Distributions The fund’s net expense ratio is 0.82 percent. The expense ratio changes based on the fund’s relative performance when compared to the benchmark Russell 2000 Index, moving up or down 0.02 percent for every 1 percent of under performance versus the benchmark Russell 2000 Index. FLPSX also has a 90-day, short-term redemption of 1.5 percent. The fund has a minimum initial investment amount of $2,500 for both taxable and non-taxable funds. There is also a minimum balance requirement of $2,000. While the fund does not have check writing, it does support direct deposit and automatic account builder functions. Outlook FLPSX has earned its four-star Morningstar rating for a reason, and that reason is Joel Tillinghast’s strong stewardship of this fund. Performance has been solid in the past few years, but the fund struggled to beat the benchmark and category. Rather than rotate fund holdings in light of the changing nature of the current late-stage recovery in the hope of chasing greater returns, fund manager Tillinghast remains focused on preserving capital and growing FLPSX though solid stock selection. We think FLPSX is poised to rebound as lower oil prices benefit consumer discretionary spending. The fund’s limited exposure to energy stocks should shield it from the negative effects of declining oil prices. The European Central Bank continuing its quantitative easing program should boost the fund’s European stock holdings. While small-cap stocks fell out of favor for much of 2014 and mid-caps trailed large caps, the fund’s focus on quality securities with lower volatility helps propel minimize losses when the overall market retreats. When the category is back in favor, FLPSX will make up lost ground. Disclosure: The author has no positions in any stocks mentioned, and no plans to initiate any positions within the next 72 hours. (More…) The author wrote this article themselves, and it expresses their own opinions. The author is not receiving compensation for it (other than from Seeking Alpha). The author has no business relationship with any company whose stock is mentioned in this article.