Tag Archives: portfolio

Third Avenue Focused Credit Tackles Distressed Debt
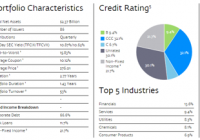
Summary TFCVX targets stressed and distressed securities, with more than half of the portfolio classified as “special situation”. Active management is a must in this area. The fund currently yields more than 10%. Third Avenue Focused Credit (MUTF: TFCVX ) is an aggressive high-yield bond fund with a focus on stressed and distressed securities. The fund seeks to deliver total return, not current yield. Strategy TFCVX’s strategy rests on what the firm calls the “Fulcrum Security…the most senior security that will likely convert into equity ownership in a restructuring.” Managers look for discounted debt securities that stand a good chance of being paid at par value in cases where the firm’s fortunes turn around, or stand a good chance of being converted to equity in a restructuring. They shy away from holding the highest-yielding debt in a company, since that debt could expire worthless, but they will also shy away from the lowest-yielding senior debt, since it doesn’t offer as attractive a yield. The fund’s sweet spot are the securities that turn into equity in a restructuring. Profit mainly comes from one of two paths: collect hefty coupon payments and see some gain on the principal, or get a controlling interest in a company as it emerges from bankruptcy or restructuring, with the opportunity for even larger upside. The big risks inherent in the strategy comes from the fact that it’s impossible to know which security will be the “Fulcrum Security” ahead of time, along with the difficulty in estimating the future value of a firm post-restructuring. Additionally, the fund is dealing in sometimes illiquid securities or opaque situations, such as a bankruptcy fight in court. Lead manager Tom Lapointe was named a 2014 Rising Star of Mutual Funds by Institutional Investor. He previously served as co-head of High-Yield Investments for Columbia Management. Portfolio As of December 31, TFCVX had $2.37 billion under management. The fund is fairly concentrated for a bond fund, with only 86 holdings. The top ten holdings accounted for 38.3 percent of assets . (click to enlarge) One of the portfolio statistics that sticks out is the $76.01 average price of securities in the fund versus the par value of $100, highlighting the fund’s ownership of distressed securities. Only 18.9 percent of the portfolio was in performing securities, with 51.7 percent classified as special situations. While TFCVX has a high yield today, the fund’s mandate and stated strategy targets total returns, which could involve holding non-income paying equities received as part of a restructuring. There is no guarantee of income, and income could decline substantially if bankruptcies increased and the fund converts debt to equity. Payouts have been in a general uptrend since inception in 2009, but this a period when the market for high-yield debt improved, allowing firms to restructure debt without declaring bankruptcy. Were there to be a period of economic stress or a deep recession, more of the fund’s holdings may become special situations, with debt converting into equity, lowering income payments. The fund’s mandate requires it to hold 80 percent of assets in credit instruments. Under the guidelines of this mandate, equity and convertible bonds acquired as part of a restructuring will be classified as credit instruments. Equities are currently only 13.7 percent of assets, but this could rise substantially under the funds mandate, materially impacting the fund’s yield. In a period of relative tranquility for high-yield debt, TFCVX has a 3-year standard deviation of 7.40 versus 4.83 for the iShares iBoxx $ High Yield Corporate Bond ETF (NYSEARCA: HYG ) and 2.85 for the Barclays U.S. Aggregate Bond Index. TFCVX has a 3-year beta of 0.01 versus the Barclays U.S. Aggregate Bond Index. HYG has a beta of 0.57 versus the same index. Compared to the Credit Suisse High-Yield Index, TFCVX has a beta of 1.16. The fund is volatile and correlated with high-yield bonds, but is less correlated to the overall bond market than other high-yield bond funds. TFCVX In A Nutshell This bit from the October 2014 shareholder letter shows why investors interested in the distressed debt market would do well to invest with capable managers (emphasis mine): We initiated a position in Ideal Standard in December 2013 at a 70% discount to where Bain had invested. We were able to accumulate 25% of the notes that we believed would be (and in the end were) the fulcrum (11.75% EUR Senior Secured Notes), buying from investors selling off the company on liquidity concerns. Up until this point this was a fairly routine investment. Complications started when the company went into reorganization and initiated an exchange offer that did not allow minority note holders, such as Third Avenue, to participate in the equity, and intended to leave us with a high-yielding fixed income instrument only. We contested this exchange offer and threatened a legal action in the US. This gave us leverage; we were able to negotiate revisions to the exchange offer that allowed us to get a 20% stake in the equity. The restructuring was completed in spring 2014. The recapitalization values the company at $500 million today. We believe this investment, a 2.1% position in the Fund as of October 31, 2014, has significant upside and limited downside. Investing in distressed debt requires a lot of homework, but even if an investor finds an undervalued security, courts and lawyers may change the facts on the ground. Small investors are unable to influence this process, but fund managers can and do influence these situations in favor of their investors. Managers are also able to grab opportunities that small investors cannot access. In another example from the shareholder letter , the fund made a bridge loan to a firm in distress, an investment opportunity that small investors cannot access on their own. Performance Warren Buffett famously said that the market was a voting machine in the short term, but a weighing machine in the long term. Third Avenue Focused Credit is a perfect illustration of this maxim at work because managers of TFCVX are engaged in long-term investments in distressed credit, but the securities they hold are subject to daily pricing. Since the outcome of distressed credit is highly volatile, with a high probability of bankruptcy, pricing of securities will be volatile. Even if investors have a high risk tolerance, they also need a long-term outlook in order to profit from the strategy employed by TFCVX because managers need time to unlock the fundamental value in these securities. As the case of Ideal Standard shows, it was not timing or even fundamental analysis that ultimately turned the position into a winner, but the threat of legal action. The value of securities held by TFCVX may be in “limbo” at times due to outstanding court cases and legal claims, leading to wild price fluctuations. Market prices for the debt held in TFCVX may deviate substantially from the underlying value, particularly when the resolution is unclear and the broader market is experiencing a bout of fear. The high-yield debt market is currently experiencing some risk aversion and the recent drop in TFCVX has led it to underperform the iShares iBoxx $ High Yield Corporate Bond ETF. (click to enlarge) The underperformance is due to the past seven months of turmoil in the high-yield debt market, influenced by the plunge in oil prices. To give a little clearer picture, in this chart, the red line represents the price ratio between HYG and the iShares iBoxx $ Investment Grade Corporate Bond ETF (NYSEARCA: LQD ). A rising line indicates HYG is outperforming. (click to enlarge) TFCVX is more sensitive to changes in investors’ risk appetites. Investors have gravitated towards investment-grade bonds and U.S. Treasuries over the past seven months, and the riskier TFCVX has suffered as a result. Fees And Expenses TFCVX has an expense ratio of 1.16 percent, which includes a management fee of 0.75 percent and a 12b-1 fee of 0.25 percent. This is a high fee relative to the high-yield bond category, but is not excessive considering the specialized nature of the fund. There is also a 2 percent short-term redemption fee on shares held less than 60 days. Conclusion TFCVX is a high-risk, high-potential reward fund. The fund opens a part of the debt market that is largely closed to small investors, one that can deliver attractive returns over the long term and add some diversification to an already well-diversified portfolio. Investors interested in TFCVX must be ready to sit through volatility. Many funds have short-term trading fees in order to reduce volatility, and TFCVX is no exception, but the negative effect from share redemptions would be amplified during a liquidity crunch in the high-yield bond market. Investors who are not comfortable with a long-term buy-and-hold approach would be better off in a more liquid high-yield bond fund. For those investors looking for total return and capital gains, TFCVX is a unique fund worth considering. The recent drop in price presents a good entry point for long-term investors. TFCVX has suffered due to risk aversion in the bond market, but the fund will rebound when demand for high-yield credit recovers. (click to enlarge) Disclosure: The author has no positions in any stocks mentioned, and no plans to initiate any positions within the next 72 hours. (More…) The author wrote this article themselves, and it expresses their own opinions. The author is not receiving compensation for it (other than from Seeking Alpha). The author has no business relationship with any company whose stock is mentioned in this article.
To Hedge Or Not To Hedge?

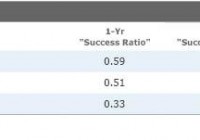
This is an updated version of an ETF Specialist originally published on Feb. 19, 2014. Currency-hedged exchange-traded funds have come into vogue of late in the United States. Investor interest was first piqued by the performance of the oldest and largest of them all: WisdomTree Japan Hedged Equity (NYSEARCA: DXJ ) . The fund owns a portfolio of dividend-paying Japanese stocks that generate more than 80% of their revenue outside of Japan. It gained nearly 42% in 2013, as a massive dose of monetary stimulus contributed to an 18% decline in the value of the Japanese yen, and steady improvement in the global economy gave Japan’s stock market an additional boost. In contrast, iShares MSCI Japan ETF (NYSEARCA: EWJ ) , which tracks a standard market-cap-weighted benchmark and does not hedge its yen exposure, increased by 26% in 2013. Clearly, it paid for U.S. investors in Japanese stocks to have a hedge against a declining yen over this span. But was this a flash in the pan, or do currency hedges have value over longer time frames? With the U.S. dollar marching steadily higher–thanks in part to (relatively) attractive interest rates–and double-digit moves in major currencies making headlines, now is a good time for investors to explore these questions. Back to Basics: Return, Risk, and the Practicalities of Putting a Currency Hedge in Place In simple terms, a domestic investor’s local-currency-denominated return in a foreign security (or a portfolio of them) is equal to the foreign security’s (or portfolio’s) return plus the foreign currency return, plus the product of the foreign security return and the foreign currency return. The last part of this equation accounts for the interplay between the two, and as it is the product of these two figures, its contribution to the overall return will grow as either the foreign asset return or the foreign security return grows larger. Domestic Currency Return = Foreign Security Return + Foreign Currency Return + (Foreign Security Return x Foreign Currency Return) The effect of fluctuating exchange rates can either help or hurt returns. In the case of U.S. investors holding Japanese stocks, the yen’s depreciation hurt the U.S. dollar return for unhedged investors in 2013, as evidenced in part by the iShares fund’s relative underperformance versus the WisdomTree offering. In another extreme example, the 34% appreciation of the Brazilian real contributed to the 124% calendar-year return posted by iShares MSCI Brazil Capped ETF (NYSEARCA: EWZ ) in 2009. These examples highlight that currency effects can be extreme in magnitude. It’s also important to consider currencies’ effect on the risk of a portfolio of foreign securities: The expression for the variance (the square root of which is the standard deviation) of a foreign security or portfolio’s returns is as follows: σ 2 $ = σ 2 LC + σ 2 S + 2σ LC σ S ρ LC,S, where σ 2 $ = the variance of the foreign asset returns in U.S. dollar terms; σ 2 LC = the variance of the foreign asset in local-currency terms; σ LC = the standard deviation of the foreign asset in local-currency terms; 2 S = the variance of the foreign currency; σ s = the standard deviation of the foreign currency; ρ LC,S = the correlation between the returns of the foreign asset in local-currency terms and movements in the foreign currency. This expression demonstrates that the volatility of a foreign asset in domestic-currency terms is directly related to the volatility of the asset in local-currency terms (the first term in the expression) and the volatility of the foreign currency (the second term). It also shows that the higher the correlation between the foreign asset in local-currency terms and movements in the foreign currency, the greater the variance will be in local currency terms. (Again, take the square root and you’ll get the standard deviation.) Hedging away currency exposure will reduce risk, as measured by standard deviation–as can be seen in Exhibit 3 below. How does currency hedging work in practice? Most currency-hedged ETFs will use currency forward contracts to reduce their foreign-currency exposure. A currency forward contract is an agreement between two parties to buy or sell a prespecified amount of a currency at some point in the future (typically one month out in the case of currency-hedged ETFs) at an exchange rate agreed upon between the two parties. Because the value of the forward contract is fixed ahead of time, and the value of the fund will fluctuate during the course of a month as asset prices and cash flows into and out of the fund fluctuate, the forward may not be a perfect hedge. It’s also important to note that these hedges come at a cost, though their price tag typically amounts to just a few basis points in the case of developed-markets currencies in stable interest-rate environments. FX Effects It is useful to look at historical data to frame the effects of currency hedging on investment performance (for U.S. investors in this case). There are two key elements to consider when assessing the effects of currencies on equity portfolios: their contribution to return (as covered above) and their contribution to risk. Exhibit 1 shows “success ratios” for a trio of MSCI benchmarks over the 20-year period ended Jan. 31, 2015. These benchmarks are all tracked by one or more currency-hedged (and unhedged) ETFs. The success ratio represents the portion of the overlapping monthly rolling one-, three-, and five-year periods over these two decades during which the unhedged version of the index outperformed its fully hedged counterpart. For example, the MSCI EAFE Index outperformed its fully hedged counterpart in 59% of these overlapping rolling one-year periods over this 20-year span. In hindsight, in the case of the MSCI EAFE and MSCI Germany benchmarks, the winner could have been predicted by the flip of a (mostly) fair coin. The story is different when it comes to the MSCI Japan Index, where “getting the yen out” has clearly paid off more often than not. Exhibit 2 contains the annualized average returns for each benchmark across each of the overlapping monthly rolling one-, three-, and five-year periods dating back 20 years from the end of January 2015. The differences in relative performance vary between the hedged and unhedged versions of these indexes depending on the length of the measurement period. The MSCI Japan Index is again a unique case, as evidenced by the yawning performance differential between its hedged and unhedged versions. What about risk? Currency risk is a significant contributor to overall risk in the context of a foreign-equity portfolio. Exhibit 3 shows the trailing 20-year annualized standard deviations and Sharpe ratios for the same benchmarks featured in the first two exhibits. In the case of all three benchmarks, it is clear–as evidenced by the difference in Sharpe ratios between the U.S. dollar and hedged versions of the indexes–that currency exposure is a meaningful source of risk, currency hedging can serve to mitigate this risk, and it may ultimately result in superior risk-adjusted performance. To Hedge or Not to Hedge? The best answer to the question of whether it makes sense to hedge the currency exposure of an international-stock portfolio is this: It depends. By hedging foreign-currency exposure, investors can mitigate a source of risk–but at the expense of a potential source of return. The trade-off between the two is important, and investors’ decisions will depend on a variety of factors, including but not limited to their return requirements, risk tolerance, investment horizon, and the costs associated with hedging currency exposure. Disclosure: Morningstar, Inc. licenses its indexes to institutions for a variety of reasons, including the creation of investment products and the benchmarking of existing products. When licensing indexes for the creation or benchmarking of investment products, Morningstar receives fees that are mainly based on fund assets under management. As of Sept. 30, 2012, AlphaPro Management, BlackRock Asset Management, First Asset, First Trust, Invesco, Merrill Lynch, Northern Trust, Nuveen, and Van Eck license one or more Morningstar indexes for this purpose. These investment products are not sponsored, issued, marketed, or sold by Morningstar. Morningstar does not make any representation regarding the advisability of investing in any investment product based on or benchmarked against a Morningstar index.

The Attractiveness Of Farmland And Other Alternative Asset Classes

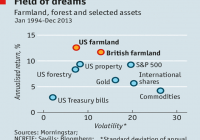
Summary Over the last ten years, the returns on more exotic alternative investments like farmland, rare coins and stamps comfortably beat the returns on the S&P 500 Index. Moreover, based on a risk-return trade off, exotic alternative asset classes also come out on top. This in contrast to more traditional alternative asset classes like commodities, hedge funds, and private equity, which have performed poorly over the last decade. Finally, although investing in exotic asset classes is much less straightforward than investing in equities and bonds, there are certainly opportunities available. Recently, The Economist published an insightful graph that showed that not equities or real estate, but farmland, was the best investment in the last few decades. And, while forestry also earned a spot in the graph, The Economist could have gone a little bit further by adding other, more exotic investment classes as well. (click to enlarge) Adding Coins, Stamps and Wine No worries, with a little help from Bloomberg, I constructed an ‘Economist-like’ chart that, next to farmland and forestry, also includes fine wine, stamps and rare coins as exotic investments. To put things into perspective, I also added ‘traditional’ alternative asset classes like commodities (NYSEARCA: DJP ), gold (NYSEARCA: GLD ), hedge funds and private equity (NYSEARCA: PSP ). Equities (NYSEARCA: SPY ) and bonds (NYSEARCA: BND ) are also included. I intended to add art as well, but art is a bit of an outlier. First, who can actually afford a Monet or Van Gogh? Second, only pieces that are actually sold get to enter the leading index (Moses MEI). This implies that the most traded (and most popular) art works are overrepresented in the index. Hence, the index comes with a classical example of ‘selection bias.’ Finally, most art investment funds are scheduled to retire in the coming years. Farmland tops the list Let’s focus on the alternatives that do make the cut. The graph below shows that, over the last ten years, farmland realized the best return with an average of 17% per year. While less exuberant than farmland, the realized returns on gold, rare coins and stamps (all roughly +10% per year) are also pretty impressive. All of these alternative investments comfortably beat the 8% annual return on the S&P 500 index over the last decade. The two remaining exotic alternatives, forestry and wine, realized an average return almost equal, but also just above, that of equities. (click to enlarge) The return data lead to the straightforward conclusion that, at least over the last 10 years, these exotic alternatives performed very well. This cannot be said of the more traditional alternative investments. While ‘smart’ investors were probably laughing at you if you didn’t add any commodities, hedge funds and/or private equity to your portfolio, these investments didn’t get you anywhere from a return perspective. Private equity performed the least worst, with an average annual return of just 2%, way less than government bonds, for example. Commodities actually yielded a negative return. Of the more ‘familiar’ alternatives, gold was the only one to keep up. Risk and Return Profile So far, I have focused on return data only. However, as risk and return often go hand in hand, a ranking based on the Sharpe ratio (return divided by standard deviation) gives a more complete overview of the relative attractiveness of assets. The graph below shows the Sharpe ratios of the different asset classes over the last ten years. (click to enlarge) As much as a ranking based on the Sharpe ratio is the sounder one, the results are not that different. Most exotic alternatives rank well on their risk-return profile. Farmland, forestry and stamps take three out of the four top spots. Government bonds move up the ranking due to their low volatility. And, as before, gold is the only one of the more traditional alternative investments to do well. Hedge funds, private equity and commodities remain far behind. Based on the risk and return data, investment classes like farmland, forestry, rare coins and stamps are very attractive alternatives. However, there are a few things to keep in mind. First, a period of ten year is not that long from an investment perspective. Things could be different for other time spans (data issues arise, however, for longer historical periods.) Second, most of these exotic alternatives suffer from sticky prices (valuation changes are artificially slow). This means volatility estimates are too low in most cases. That said, the Sharpe ratios suggest it would take a serious volatility increase to push the exotic alternatives down the ranking. Investment Opportunities Now I guess many investors will anticipate another, third factor to keep in mind when looking at these exotic investment alternatives. And that is, availability. Because, how do you invest in (a diversified basket of) farmland or forestry, for example? While this question is totally legit, getting exposure to these alternatives is nowhere near as straightforward as investments in equities and bonds, there are possibilities. Some of them are actually listed. Farmland Partners (NYSEMKT: FPI ) acquires high-quality primary row crop farmland located in agricultural markets throughout North America. Adecoagro (NYSE: AGRO ) from Brazil and Cresud (NASDAQ: CRESY ) from Argentina, invest in farmland and crop production activities in South America. And there are more of these companies around the globe. They are mostly located in emerging markets, as most of the arable land can be found here. On top of that, there are dozens of private investment companies like the Hancock Agricultural Investment Group or Duxton Asset Management from Australia that also offer investment opportunities in farmland or forestry. For other exotic alternatives there are opportunities as well. For example, Stanley Gibbons Investment is a leading company focused on investing in stamps and rare coins. For wine, there is a whole range of private investment funds available. Examples are the Wine Asset Managers, The Wine Investment Fund and Lunzer Wine Investments. But there are many, many more. These companies select, buy and store a variety of wines and save you the hassle of doing this all by yourself. Hence, some of these companies do not only invest in wine but also in whole vineyards as a means of diversification. Mind you, the companies mentioned above are just examples of possibilities to invest in more exotic investment classes like farmland, stamps and wine. You should conduct your own research to find out if these companies offer investment opportunities suitable for you. Investing in these alternatives will require some serious ‘due diligence.’ But, with the disappointing returns of traditional alternative investments in mind, that effort could turn out to be rewarding! Disclosure: The author has no positions in any stocks mentioned, and no plans to initiate any positions within the next 72 hours. (More…) The author wrote this article themselves, and it expresses their own opinions. The author is not receiving compensation for it (other than from Seeking Alpha). The author has no business relationship with any company whose stock is mentioned in this article.