Tag Archives: over-the-last

Dividend Growth Stock Overview: WGL Holdings, Inc.

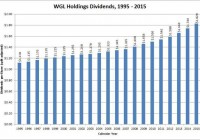
Summary WGL Holdings provides over 1 million customers in the mid-Atlantic region with energy services. The company has paid dividends for over 160 years and raised them for nearly 40 years. The company sees gains in earnings of 8-16% in 2015; long-term objectives are to increase earnings by 5-7% a year. WGL Holdings has grown dividends by an average of 4% annually over the last 5 years and 2.5% over the last two decades. About WGL Holdings, Inc. WGL Holdings, Inc. (NYSE: WGL ) is a utility holding company with multiple subsidiaries serving Washington, D.C. and the surrounding areas. The company operates multiple subsidiaries, but its largest subsidiary is Washington Gas, which provides natural gas service to more than 1.1 million customers in D.C., Maryland and Virginia. WGL Holdings has more than 1400 employees and is headquartered in Washington, D.C. WGL Holdings’ operations include: Distribution/Regulated Utility: This operation distributes natural gas to Washington Gas customers and other regulated energy markets. Distributed Generation: This operation is responsible for designing, building and operating on-site energy systems. Included in this is the WGL Energy Systems subsidiary, which is responsible for WGL’s green energy solutions. Retail Supply/Energy: This operation markets and distributes energy to competitive and unregulated markets. Midstream: The midstream operation is run by the WGL Midstream subsidiary, which invests in and owns natural gas pipelines and storage facilities in the Midwest and Eastern U.S. and is responsible for supplying the wholesale market customers – including Washington Gas – with natural gas. In the 2014 fiscal year, which ended September 30, 2014, WGL Holdings reported net income of $105.9 million, up 31.9% from $80.3 million in the prior year (all figures are GAAP numbers). Earnings per share in 2014 were $2.05, up 32.3% from $1.55 per share in the prior year. The year-over-year growth can be attributed to an increase in earnings in the regulated utility and midstream energy services operating segments. Regulated Utility earnings increased 36% to $1.89 per share while Midstream Energy services earnings swung to a gain of 12 cents per share from a loss of 36 cents per share in 2013. This more than offset the 75% drop in earnings from Retail Energy operations. The WGL board expects that the 2015 fiscal year will see earnings grow by 8-16%, which exceeds the company’s long-term earnings growth objectives of 5-7%. The company is a member of the S&P Mid Cap 400 index and S&P’s High Yield Dividend Aristocrats index, and trades under the ticker symbol WGL. WGL Holdings’ Dividend and Stock Split History (click to enlarge) WGL Holdings has paid dividends for over 160 years and increased them since 1977. The company usually announces dividend increases at the beginning of February, with the stock going ex-dividend in April. In February 2015, WGL Holdings announced a 5.1% increase in its dividend to an annualized rate of $1.85. I expect WGL to announce its 40th annual dividend increase in February 2016. Like most mature utility companies, WGL Holdings has a record of very slow dividend growth. The recent dividend increase of 5.1% is the largest in over 25 years. The company has a 5-year compounded annual dividend growth rate (CADGR) of 4.03%, and a 10-year CADGR of 3.29%. Longer term, the dividend growth rates are even lower, with 20-year and 25-year CADGRs of 2.49% and 2.40%. WGL Holdings has split its stock twice 2-for-1 since beginning its record of dividend growth in 1977. The most recent split was in May 1995. Prior to that, the company split the stock in November 1984. For each share of WGL stock that you owned in the early 1980s, you would now have 4 shares of stock. Over the 5 years ending on December 31, 2014, WGL Holdings stock appreciated at an annualized rate of 14.84%, from a split adjusted $27.12 to $54.17. This outperformed the 13.0% annualized return of the S&P 500 and roughly matched the 14.9% annualized return of the S&P Mid Cap 400 index during this time. WGL Holdings’ Direct Purchase and Dividend Reinvestment Plans WGL Holdings, Inc. has both direct purchase and dividend reinvestment plans. The plans’ fees are not too onerous. You do not need to be an existing shareholder to participate. As a new investor, you’ll pay a one-time enrollment fee of $15. There are no fees associated with purchasing shares, either directly or through dividend reinvestment. For new investors, the minimum purchase amount is $250. Once you begin participating in the plan, the minimum purchase amount is $50. When you sell your shares in the plan, you’ll pay a fee of either $15 or $25 plus a transaction fee of 12 cents per share sold. You’ll also be charged an additional $15 if you request help from a customer service representative in placing a sales order. All the fees will be deducted from the sales proceeds. Disclosure: The author has no positions in any stocks mentioned, and no plans to initiate any positions within the next 72 hours. (More…) The author wrote this article themselves, and it expresses their own opinions. The author is not receiving compensation for it. The author has no business relationship with any company whose stock is mentioned in this article.

European Funds See Inflows For 6-Consecutive Weeks

Stock funds attracted $8.4 billion for the week ending Mar 4, according to data from Lipper. This was the biggest inflow since late December. Of these, $6.9 billion was invested in non-U.S. stock funds. U.S.-focused stock funds added $1.5 billion. This came just a week after the U.S. investors had poured the most money into non-domestic stock funds since 2013. Jeff Tjornehoj, head of Lipper Americas Research said: I think those investors are expecting a rally in European stocks after the ECB opens the QE (quantitative easing) spigots next week. As for the broader markets, it has been a mixed week so far. Optimism that the U.S. economy was gradually picking up the pace had boosted benchmarks to record highs on Monday. Nasdaq had closed above the 5k mark for the first time since Mar 2000 boosted by a new deal in the technology sector. However, markets then dropped for two consecutive days, dragged down by dismal monthly car sales and a drop in private-sector employment gains in February, among other factors. Markets rebounded on Thursday, somewhat boosted by the ECB announcing a trillion-dollar stimulus plan that will kick off on Monday. Till close of markets on Mar 5, the Dow and Nasdaq are up just 0.02% and 0.07%, while the S&P 500 is down 0.2%. Funds Flow Data As mentioned, while $6.9 billion was poured into non-U.S. stock funds, U.S.-focused stock funds added $1.5 billion. U.S.-focused stock funds were able to witness inflows, after it lost $3.1 billion in outflows in the prior week. This was the biggest outflow in three weeks. Coming back to this week, U.S.-based European stock funds witnessed inflows for the sixth-consecutive week, adding $708 million for week ending Mar 4. Inflows into these funds may have been due to investors’ expectation of a rally as the ECB begins the bond repurchase plan. Emerging market stock funds added $1.4 billion, the most since Jun 2014. Separately, Taxable bond funds and high-yield “junk” bond funds registered their ninth and sixth consecutive week of inflows, respectively. While taxable bond funds added $170 million, the latter attracted $309 million. U.S. Treasuries funds had the biggest outflows since Jun 2014, losing out on $2.8 billion. On the other hand, the Investment Company Institute reported total money market fund assets were $2.67 trillion for the week ended Mar 4, down by $18.60 billion. Markets and Key Developments This Week On Monday, Nasdaq closed above the 5000 mark for the first time since Mar 2000 boosted by a new deal in technology sector. The Dow and the S&P 500 also touched record highs as the U.S. economy is seen to be gradually picking up the pace. Markets ended in the green, despite reports of a slowdown in manufacturing activity and consumer spending. Meanwhile, interest cuts in China also drove benchmarks higher on Monday. The S&P 500 and Dow closed at a record high for the fifth and fourth time this year, respectively. Dismal monthly car sales report dragged benchmarks down from their record highs in light volume trade on Tuesday. Profit taking also retreated Nasdaq from its key 5K level. Also affecting the markets was Israeli Prime Minister Benjamin Netanyahu’s criticism of White House and Iran’s attempts of a nuclear deal. Markets ended in the red for the second consecutive day on Wednesday, handing the Dow and S&P 500 their worst closing levels since Feb 19. Some opined there was no real panic in the markets. Private-sector employment gains in February were lower than prior month. Separately, ISM services index showed modest improvement. Markets snapped a two-day losing streak on Thursday, somewhat boosted by the ECB announcing a trillion-dollar stimulus plan that will kick off on Monday. Higher-than-expected initial claims numbers had offset some gains on Thursday. It was the year’s second lightest trading session, as investors refrained from betting big bucks ahead of Friday’s nonfarm payroll report. The jobs number may influence the timing of the rate hike decision. ECB Stimulus : The European Central Bank (ECB) announced a 1 trillion euro ($1.1 trillion) bond-buying program. The repurchase is due to start from coming Monday, Mar 9. As announced in January, ECB will buy government bonds worth 60 billion euros a month through a quantitative easing program. The QE program will continue till Sep 2016. ECB President Mario Draghi said this time that ECB would purchase these bonds even if they have a negative yield. However, the negative yield should not cross -0.2%, as they need to be within the level of ECB’s deposit rate. The bank also increased growth and inflation targets. Growth estimates were revised up to 1.5%, 1.9% and 2.1% for 2015, 2016 and 2017 respectively. Draghi said: The substantial, additional easing of our monetary policy stands, supports and reinforces the emergence of more favorable developments of the euro area economy, financial market conditions and the cost of external finance for the private economy have eased further. Borrowing conditions for firms and households have improved considerably. Obamacare in Court : Another key event of this week has been the commencement of the third hearing on Obamacare in the U.S. Supreme Court. King v. Burwell is the biggest challenge Obamacare has had to deal with till now and threatens to derail President Obama’s signature policy measure. 3 Mutual Funds to Buy Given the continued inflows into the non-US stock funds and particularly in the U.S.-based European stock funds, we would suggest 3 Non-US Equity funds, that are likely to see further upside. These funds carry either a Zacks Mutual Fund Rank #1 (Strong Buy) or Zacks Mutual Fund Rank #2 (Buy). Remember, the goal of the Zacks Mutual Fund Rank is to guide investors to identify potential winners and losers. Unlike most of the fund-rating systems, the Zacks Mutual Fund Rank is not just focused on past performance, but the likely future success of the fund. Also, the funds have high total return over the last four weeks, carry no sales load and have low expense ratio. The minimum initial investment in these funds is $5000. Henderson European Focus Fund (MUTF: HFEIX ) seeks capital growth over the long term. The fund invests a majority of its net assets in equities of European firms. The fund has no limits regarding geographic asset distribution within Europe. It may invest in one country or limited number of countries. HFEIX carries a Zacks Mutual Fund Rank #2. It has returned 8.1% over the last four weeks. It carries an expense ratio of 1.11% as compared to category average of 1.50%. Ivy International Core Equity Fund (MUTF: ICEIX ) invests a lion’s share of its assets, and borrowings, in equities that are mostly traded in developed European and Asian/Pacific Basin markets. To boost return, the fund may also invest in those issuers who are either located or operate in emerging market countries. ICEIX carries a Zacks Mutual Fund Rank #1. It has returned 5.5% over the last four weeks. It carries an expense ratio of 1.04% as compared to category average of 1.19%. VY T. Rowe Price International Stock Portfolio (MUTF: IMASX ) seeks capital appreciation over the long term. The fund invests a majority of its assets in stocks of companies located outside the U.S. For diversification, the fund invests in among developed and emerging countries. The fund emphasizes large-cap companies, and to an extent also invests in mid-cap firms. However, the fund may invest in companies of all sizes. IMASX carries a Zacks Mutual Fund Rank #2. It has returned 5.5% over the last four weeks. It carries an expense ratio of 0.77% as compared to category average of 1.37%.

The Attractiveness Of Farmland And Other Alternative Asset Classes

Summary Over the last ten years, the returns on more exotic alternative investments like farmland, rare coins and stamps comfortably beat the returns on the S&P 500 Index. Moreover, based on a risk-return trade off, exotic alternative asset classes also come out on top. This in contrast to more traditional alternative asset classes like commodities, hedge funds, and private equity, which have performed poorly over the last decade. Finally, although investing in exotic asset classes is much less straightforward than investing in equities and bonds, there are certainly opportunities available. Recently, The Economist published an insightful graph that showed that not equities or real estate, but farmland, was the best investment in the last few decades. And, while forestry also earned a spot in the graph, The Economist could have gone a little bit further by adding other, more exotic investment classes as well. (click to enlarge) Adding Coins, Stamps and Wine No worries, with a little help from Bloomberg, I constructed an ‘Economist-like’ chart that, next to farmland and forestry, also includes fine wine, stamps and rare coins as exotic investments. To put things into perspective, I also added ‘traditional’ alternative asset classes like commodities (NYSEARCA: DJP ), gold (NYSEARCA: GLD ), hedge funds and private equity (NYSEARCA: PSP ). Equities (NYSEARCA: SPY ) and bonds (NYSEARCA: BND ) are also included. I intended to add art as well, but art is a bit of an outlier. First, who can actually afford a Monet or Van Gogh? Second, only pieces that are actually sold get to enter the leading index (Moses MEI). This implies that the most traded (and most popular) art works are overrepresented in the index. Hence, the index comes with a classical example of ‘selection bias.’ Finally, most art investment funds are scheduled to retire in the coming years. Farmland tops the list Let’s focus on the alternatives that do make the cut. The graph below shows that, over the last ten years, farmland realized the best return with an average of 17% per year. While less exuberant than farmland, the realized returns on gold, rare coins and stamps (all roughly +10% per year) are also pretty impressive. All of these alternative investments comfortably beat the 8% annual return on the S&P 500 index over the last decade. The two remaining exotic alternatives, forestry and wine, realized an average return almost equal, but also just above, that of equities. (click to enlarge) The return data lead to the straightforward conclusion that, at least over the last 10 years, these exotic alternatives performed very well. This cannot be said of the more traditional alternative investments. While ‘smart’ investors were probably laughing at you if you didn’t add any commodities, hedge funds and/or private equity to your portfolio, these investments didn’t get you anywhere from a return perspective. Private equity performed the least worst, with an average annual return of just 2%, way less than government bonds, for example. Commodities actually yielded a negative return. Of the more ‘familiar’ alternatives, gold was the only one to keep up. Risk and Return Profile So far, I have focused on return data only. However, as risk and return often go hand in hand, a ranking based on the Sharpe ratio (return divided by standard deviation) gives a more complete overview of the relative attractiveness of assets. The graph below shows the Sharpe ratios of the different asset classes over the last ten years. (click to enlarge) As much as a ranking based on the Sharpe ratio is the sounder one, the results are not that different. Most exotic alternatives rank well on their risk-return profile. Farmland, forestry and stamps take three out of the four top spots. Government bonds move up the ranking due to their low volatility. And, as before, gold is the only one of the more traditional alternative investments to do well. Hedge funds, private equity and commodities remain far behind. Based on the risk and return data, investment classes like farmland, forestry, rare coins and stamps are very attractive alternatives. However, there are a few things to keep in mind. First, a period of ten year is not that long from an investment perspective. Things could be different for other time spans (data issues arise, however, for longer historical periods.) Second, most of these exotic alternatives suffer from sticky prices (valuation changes are artificially slow). This means volatility estimates are too low in most cases. That said, the Sharpe ratios suggest it would take a serious volatility increase to push the exotic alternatives down the ranking. Investment Opportunities Now I guess many investors will anticipate another, third factor to keep in mind when looking at these exotic investment alternatives. And that is, availability. Because, how do you invest in (a diversified basket of) farmland or forestry, for example? While this question is totally legit, getting exposure to these alternatives is nowhere near as straightforward as investments in equities and bonds, there are possibilities. Some of them are actually listed. Farmland Partners (NYSEMKT: FPI ) acquires high-quality primary row crop farmland located in agricultural markets throughout North America. Adecoagro (NYSE: AGRO ) from Brazil and Cresud (NASDAQ: CRESY ) from Argentina, invest in farmland and crop production activities in South America. And there are more of these companies around the globe. They are mostly located in emerging markets, as most of the arable land can be found here. On top of that, there are dozens of private investment companies like the Hancock Agricultural Investment Group or Duxton Asset Management from Australia that also offer investment opportunities in farmland or forestry. For other exotic alternatives there are opportunities as well. For example, Stanley Gibbons Investment is a leading company focused on investing in stamps and rare coins. For wine, there is a whole range of private investment funds available. Examples are the Wine Asset Managers, The Wine Investment Fund and Lunzer Wine Investments. But there are many, many more. These companies select, buy and store a variety of wines and save you the hassle of doing this all by yourself. Hence, some of these companies do not only invest in wine but also in whole vineyards as a means of diversification. Mind you, the companies mentioned above are just examples of possibilities to invest in more exotic investment classes like farmland, stamps and wine. You should conduct your own research to find out if these companies offer investment opportunities suitable for you. Investing in these alternatives will require some serious ‘due diligence.’ But, with the disappointing returns of traditional alternative investments in mind, that effort could turn out to be rewarding! Disclosure: The author has no positions in any stocks mentioned, and no plans to initiate any positions within the next 72 hours. (More…) The author wrote this article themselves, and it expresses their own opinions. The author is not receiving compensation for it (other than from Seeking Alpha). The author has no business relationship with any company whose stock is mentioned in this article.