Tag Archives: nreum

DCF Myth 2: A DCF Is An Exercise In Modeling And Number Crunching!

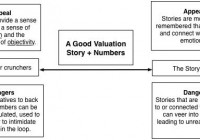
Most people don’t trust DCF valuations, and with good reason. Analysts find ways to hide their bias in their inputs and use complexity to intimidate those who not as well versed in the valuation game. This may surprise you, but I understand and share that mistrust, especially since I know how easy it is to manipulate numbers to yield almost any value that you want, and to delude yourself, in the process. It is for this reason that I have argued that the test of a valuation is not in the inputs or in the modeling, but in the story underlying the numbers and how well that story holds up to scrutiny. Left brain, meet right brain! This fall, as I have twice a year, for almost 30 years, I will be teaching a valuation class at the Stern School of Business at New York University. When the 300 registered students walk into my classroom, I know that they will come in with preconceptions about what the class will cover. Many will bring in their laptops, with the latest version of Microsoft Excel installed, eagerly anticipating session after session on modeling, hoping to become Excel Ninjas, by the time the class is done. They expect it to be a class about numbers, more numbers and still more numbers, with Greek alphabets (alphas and betas) thrown in. I begin the class by asking students to tell me whether each of them is more comfortable with numbers or with stories, and not surprisingly, the class draws disproportionately large numbers of the former, but there are more than a handful of the latter. (There are a number of tests online, like this one , that you can take to make this judgment for yourself, but most of us have a sense without tests.). I then explain my vision of valuation, as a bridge between the two groups, a way of connecting narratives to numbers. While this picture is only an abstraction in that first class, the rest of the class is really my attempt to flesh out the picture and make the bridge real. I don’t always succeed, but my vision of a successful class is that my number crunchers walk out with a little more imagination and that my storytellers acquire a bit more discipline along the way. Connecting Stories to Numbers: The Process The process by which you connect stories to numbers is neither obvious nor intuitive, but it can be learned. In an earlier post on the topic , I laid out five steps in this process, not intended to be either exhaustive or sequential. To illustrate, consider Amazon (NASDAQ: AMZN ), a high profile company where the world is divided into those that believe that it is an extraordinary company with a plan to conquer the world and those that use it as an example of how you can fool a lot of people for a really long time. In a post in October 2014 , I valued Amazon and arrived at a value of $175 per share. (click to enlarge) Rather than get stuck into the details, it is worth laying bare the narrative that I have for Amazon that is determining its value. In my story, Amazon will continue on its path of delivering high revenue growth (with revenues growing to $249 billion by year 10), generally by selling products or offering services at or below cost for the near future (note that margins stay close to zero for the next 5 years), but will eventually start to use its market power to deliver profits, but this market power will be checked by the entry of new players into the retail business, leaving the target margin at a number (7.36%) that reflects the overall retail business in 2014. To see where the optimists in the spectrum come up with higher value, consider an alternative narrative, where Amazon’s market power is unchecked allowing it to expand into more extensively in the media market (with revenues of $329 billion in year 10) and earn an operating margin of 12.84% (the 75th percentile of retail/media firms). Those changes increase the value per share to $468/share. (click to enlarge) To complete the process, consider the pessimistic narrative. In their story, they see Amazon as a company with a charismatic CEO (Jeff Bezos) who is less interested in creating a profitable business than he is in changing the retail world. In that story, Amazon will continue to grow revenues with little attention paid to margins, with the end game being world domination (at least of the retail business). In the valuation, that translates into higher revenue growth and paper-thin operating margins (2.85%, the 25th percentile of large US retail/media firms), even in steady state, the value per share drops to $32/share. (click to enlarge) I followed up my post on narratives and numbers with one on how a change, shift or break in the narrative can translate into a significant change in value , and why the conventional view that intrinsic value, if done right, is timeless is nonsense. Using earnings reports as the vehicles that deliver news about narratives, I looked at my narratives for Apple (NASDAQ: AAPL ), Twitter (NYSE: TWTR ) and Facebook (NASDAQ: FB ) in August 2014, and valued them. Since the last few weeks have brought new earnings reports from all three companies, I will be doing an updated version of that post in the next few days. If you are a number cruncher, this process may seem too free form and subjective to you, and if you are a storyteller, the numbers will seem made up. To me, though, it is the essence of valuation and if you are interested in my extended discussion of this process of connecting narratives to numbers, you may want to take a look at this keynote talk that I gave at the CFA Institute Conference last year. I have to warn you that the length of the webcast (almost 3 hours) could lead you to seek the protection of the Geneva Conventions. Tie to the life cycle: The Investor Angle While narrative and numbers are tied together in every company’s valuation, the importance of each in driving value will shift over a company’s life cycle, as it evolves from a start up to a mature firm to one in decline. Very early in the life cycle, when numbers on the company are either scarce or uninformative, it is almost entirely narrative that drives value. In addition, that narrative can also have a much wider range of possibilities and end values, depending on the path that you map out for the company. In December 2014, I let readers pick their narrative for Uber and mapped out widely divergent values (ranging from less than $1 billion to in excess of $90 billion) for the company, based on the narrative path picked. As companies mature, the numbers start to get weighted more, as it becomes more difficult for companies to not only break away from the past, but the pathways narrow. If you are valuing Coca-Cola (NYSE: KO ), for instance, it is more difficult to visualize explosive breakaways (either up or down in the narrative), though not impossible. If you are an investor uninterested in valuing companies, there are still lessons that you can draw from the link between where a company is in its life cycle and the importance of narrative/numbers. Value Differences: If you get big differences in the perceived value of a young company, they come from fundamentally different narratives about the company, not disagreements about the numbers. Thus, if your assessment of Etsy’s (NASDAQ: ETSY ) value is very different from mine, it is not because we disagree about revenue growth next year but because we have fundamentally different narratives about the company. Value focus: Early in the life cycle, large value changes have to come from large narrative shifts (resulting in large changes in value). Consequently, the focus when you scrutinize earnings reports and other news announcements should be on whether they change your narrative, not on whether the company met or beat some metric (earnings per share, revenues, number of users). To illustrate, much as I have taken issue with the market pricing of Tesla (NASDAQ: TSLA ), I think it seems to me an overreaction, to knock off 15% of its price because it sold 50,000 cars instead of 55,000 , since I see little change in the narrative for Tesla, as a consequence. In contrast, I do think that Tesla’s announcement of a $5 billion investment in a battery factory is cause for a big narrative change (though I am still trying to figure out in which direction), as it may shift your view of the company for an auto manufacturer to an energy producer. (I know… I know… It is time for another look at Tesla as well, and I will…) Value mistakes: If the essence of investing is finding misvalued companies, it seems to me that the odds of doing so are greater early in a company’s life cycle, where narratives can get mangled or when investors overreact to incremental reports. As the investment world gets flatter (in terms of everyone having access to past numbers), the most successful investors of the next millennium will be those are skilled at creating and fine tuning narratives for young companies or those in transition. Tie to the Life Cycle: Implications for managers The link between narratives and value has implications for those who run businesses and for what defines success for a top manager as companies move through the life cycle. Narrative control: If it is narrative that drives value early in the process, it should come as no surprise that the most successful entrepreneurs are the ones who are best at establishing narratives that are compelling, plausible and potentially profitable. Thus, Tesla is lucky to have Elon Musk as a CEO, and Uber has been fortunate with Travis Kalanick at its helm. Both men have their faults (who does not?), but they are enormously gifted storytellers, who (for the most part) have the discipline to stick with their narratives, even in the face of distractions. Narrative consistency: One characteristic that sets apart top managers at those young growth companies that have succeeded is that they have (a) not changed their narratives substantively and (b) have acted consistently with their narratives. The stand out example for this is Jeff Bezos, who has stuck with his narrative of “revenues now, profits later” story for Amazon, sometimes to the chagrin of analysts, and everything that the company has done and continues to do advances that narrative. Mark Zuckerberg has been almost as impressive in his focus on turning Facebook’s immense user base into profits, albeit over a shorter period, but one reason for Twitter’s travails is that there seems to be no coherent narrative emerging about how the company ultimately plans to make money. Bar Mitzvah Moments: In keeping with the theme of this post, which is that narratives have to be tied to numbers, it is worth emphasizing that even the most compelling and consistent narrative will ultimately fail, if the company cannot deliver the numbers to back it up. It is true that this “day of reckoning”, which I labeled a “bar mitzvah” moment , may come later for some companies than for others, but when it does come, you need a management team that recognizes that the market has shifted its focus from narrative to numbers, and behaves accordingly. I have tried to capture the change in balance between narrative and numbers, with the management qualities that are most needed at each stage in the picture below: (click to enlarge) As a company makes it move from young start-up to growth company to mature business, the characteristics that make up a good CEO will change as well. One argument for a strong board of directors and shareholder power even at a well-managed young company is that there may well come a time when the top management has to change with the times or be changed. Work on your weak side There is no one path to valuation nirvana, but I think that you need to find a balance between your storytelling and your number crunching skills, for your valuations to have heft. This balance may come easier to you than it did to me, since my natural instincts are to go with the numbers, and building my storytelling side has been slow going, at times. With each valuation that I do, I still have to force myself to be explicit about the narrative that I am building my valuation around, even when it seems obvious, and each time I do it, it gets a little easier. If you are a natural storyteller, you will probably find yourself resisting just as strongly to working with numbers, but I believe that you too will find a way to strengthen your weak side. I would like to think that a valuation that is the result of both sides of my brain working together is better than one that emerges out of only my left side, but even if it is not, it is a lot more fun getting there. Blog Posts Narrative and Numbers: Modeling, Story Telling and Investing (June 2014) If you build it (revenues), they (profits) will come: Amazon’s Field of Dreams (October 2014) Reacting to Earnings Reports: Narrative Adjustments and Value Effects (August 2014) Up, up and away: A Crowd Valuation of Uber (December 2014) Twitter’s Bar Mitzvah: Is social media coming of age? (November 17, 2014) Reacting to Earnings Reports II: Apple, Twitter and Facebook revisited (August 2015) (Still to come) Valuations Amazon Valuation (October 2014) Uber Valuation (December 2014) Other My keynote talk at the CFA Conference in November 2014 DCF Myth Posts Introductory Post: DCF Valuations: Academic Exercise, Sales Pitch or Investor Tool If you have a D(discount rate) and a CF (cash flow), you have a DCF. A DCF is an exercise in modeling & number crunching. You cannot do a DCF when there is too much uncertainty. The most critical input in a DCF is the discount rate and if you don’t believe in modern portfolio theory (or beta), you cannot use a DCF. If most of your value in a DCF comes from the terminal value, there is something wrong with your DCF. A DCF requires too many assumptions and can be manipulated to yield any value you want. A DCF cannot value brand name or other intangibles. A DCF yields a conservative estimate of value. If your DCF value changes significantly over time, there is either something wrong with your valuation. A DCF is an academic exercise.

An Update On 4 Tactical/Momentum ETFs

Summary Four tactical/momentum ETFs debuted in late 2014. These ETFs have the ability to switch between equities, bonds or other assets based on trailing momentum and/or volatility. How have these ETFs fared in the 9 months since inception? Introduction In a previous article , I discussed the debut of 4 tactical/momentum ETFs. Broadly speaking, these ETFs aim to exploit the momentum factor, which is often regarded as the premier anomaly due to its persistent outperformance over long periods of time. Stocks that have done well recently tend to continue to do well, while stocks that have done poorly recently tend to continue to do poorly. The momentum concept is embodied in aphorisms such as “Cut your losers and let your winners run.” Momentum works well not only within asset classes, but also between them. A momentum strategy that switches between stocks and bonds, for example (also known as “tactical” allocation), may well have allowed an investor to avoid the worst stock market crashes in history. A number of Seeking Alpha authors have presented various simple momentum strategies that have highly impressive backtested performance, such as varan , Frank Grossman and others. Recently, Left Banker described his own momentum strategy that had him reaping the rewards of treasury bonds in 2014. For investors who lack the time or inclination to implement their own tactical/momentum strategies, ETFs may be a valid alternative. Four such ETFs were launched in October or November of 2014. Cambria Global Momentum ETF (NYSEARCA: GMOM ) Global X JPMorgan US Sector Rotator Index ETF (NYSEARCA: SCTO ) Global X JPMorgan Efficiente Index ETF (NYSEARCA: EFFE ) Arrow DWA Tactical ETF (NASDAQ: DWAT ) For further details on the methodology of each of these ETFs, please see my previous article . Note that all four funds have the ability, at the minimum, to switch between equities and bonds. Hence, equity-only momentum funds, of which there are many, were excluded from this comparison. Given that it has been around 9 months since the debut of these four ETFs, I thought it would be a good time to assess their performance since their inception. Results The total return history of the four ETFs since the inception date of the newest fund (Nov. 2014) is shown below. GMOM Total Return Price data by YCharts The chart above shows that DWAT has had the highest total return of 1.94%, while SCTO has the lowest return of -3.33%. How does this compare with some of the most common benchmarks? The following 12 asset classes were selected as a comparison: U.S. equities (NYSEARCA: SPY ) Developed markets ex-U.S. equities (EAFE) Emerging market equities (NYSEARCA: EEM ) U.S. long-term treasuries (NYSEARCA: TLT ) U.S. intermediate-term treasuries (NYSEARCA: IEF ) U.S. investment grade bonds (NYSEARCA: LQD ) U.S. high-yield bonds (NYSEARCA: JNK ) Emerging market bonds (NYSEARCA: EMB ) U.S. real estate (NYSEARCA: VNQ ) Ex-U.S. real estate (NASDAQ: VNQI ) Commodities (NYSEARCA: DBC ) Global market portfolio (NYSEARCA: GAA ) The following bar chart shows the total return performances of the four tactical/momentum ETFs plus the 12 asset classes since Nov. 2014. The tactical/momentum ETFs are shown in green, equities in blue, bonds in red and other asset classes in yellow. We can see from the chart above that there has been quite a wide dispersion of return performances, with the highest being TLT at 6.35% and the lowest being DBC at -30.2%. The following chart is the same as that above except with DBC removed, in order to make the differences between the other funds easier to visualize. Discussion At first glance, it seems that the four tactical/momentum ETFs underperformed. U.S. stocks, as represented by SPY, returned 5.35% over the past 9 months, while the four U.S. bond ETFs averaged 1.57%. In contrast, the four tactical/momentum ETFs averaged only -1.19%. However, as Seeking Alpha author GestaltU has convincingly argued , a 60/40 U.S. stock/bond mix is not an appropriate benchmark for global tactical asset allocation [GTAA] strategies. Instead, the benchmark should be the investible global market portfolio [GMP]. This portfolio is nicely represented by the Cambria Global Asset Allocation ETF, ticker symbol GAA, which is the last asset class data point shown in the charts above. GAA returned -1.02% over the past nine months. This suggests that the four tactical/momentum ETFs did not significantly underperform this benchmark over the past nine months. Conclusions This article provides an update to four tactical/momentum ETFs that were launched around nine months ago. With domestic equities continuing to grind higher, many investors have been considering reducing their exposure to this space. For investors uncomfortable with market timing (like myself), the use of a tactical/momentum fund may allow investors to, in an ostensibly “passive” manner, stay invested in the outperforming markets such as the U.S. until the tide turns. However, this study also revealed a drawback of the tactical/momentum funds. None of these ETFs were apparently able to capture the full, or even any, upside of the domestic equity market (+5.35%) over the past nine months; in fact, as a group, the four ETFs exhibited a negative total return of -1.19%. This is especially surprising for SCTO (-3.33%), which invests only in U.S. sectors and/or U.S. short-term treasuries, and nothing else. Thus, investors should not expect the tactical ETFs to keep pace with the U.S. bull market, if it continues. Disclosure: I am/we are long GMOM. (More…) I wrote this article myself, and it expresses my own opinions. I am not receiving compensation for it (other than from Seeking Alpha). I have no business relationship with any company whose stock is mentioned in this article.

Money Managers Hate Me For This One Weird Trick…

Summary An S&P 500 ETF should be the cornerstone of a well-diversified long term portfolio. I will compare the most widely known S&P 500 ETF SPY against two viable alternatives IVV and VOO. The metrics I will use are as follows: expense, historical performance, portfolio composition, total assets, volume, yield, NAV, standard deviation, and correlation. … Which is recommending that you buy the index and call it day. Boring? Perhaps. Sexy? Nope. You know what is nice though? Not having to work until you die because you were unable to save enough money for retirement. Having money to send your children to college. What else? Not getting ripped off by some “savvy money manager” that charges predatory fees. Sure you can Seek Alpha all your life, but who do you listen to? Why pay exorbitant fees for hit or miss advice? There is an optimal investment opportunity out there, and best of all, you only need access to a brokerage account to buy into it. It is called a low-cost S&P 500 ETF. Premise I firmly believe an index fund like the S&P 500 ETF (NYSEARCA: SPY ) should be a core part of a balanced long-term portfolio. The S&P 500 is comprised of 500 of the healthiest, strongest, and most widely traded stocks on the market. Investing in an S&P 500 ETF gives the investor diversified exposure to this valuable class of equities while mitigating single stock risk. I mentioned in another article that the S&P 500’s historical long term annual returns (assuming a 20-year time frame) have ranged from 5.5% to 18% . S&P averages roughly 10% returns year over year. Holding a long term-position in an ETF like SPY is intuitively the best investing decision you could ever make (I will likely write several additional articles on this subject). However, in this particular article I will focus solely on cross-analyzing and comparing the 3 primary S&P 500 ETFs available. I personally hold a long position in SPY, but I think it’s valuable to consider two alternatives iShares Core S&P 500 ETF (NYSEARCA: IVV ) and Vanguard S&P 500 ETF (NYSEARCA: VOO ). Correlation The first thing I look for in an ETF is a strong correlation to its underlying index. SPY, IVV, and VOO all display a direct and positive correlation to the S&P 500, so thankfully tracking error is not going to be a major issue. Historical Performance & My Biggest Concern Comparable returns have always grouped closely together. Interestingly, each ETF has tended to marginally outperform the S&P 500 index in the short and long run. In the last five years the index and each ETF saw around 14.75% returns annually. However, I believe this percentage is uncharacteristically high due to persistently and artificially low interest rates. This phenomenon is mostly guided by Fed backed programs which I believe have produced inflationary upward pressure on stock prices. My biggest concern for this ETF is that the stock market as a whole appears overvalued, and a market correction does not seem unfeasible (at least in the short term). As a long term investor, I am maintaining my position, but do not be surprised if these ETFs do not have future returns on par with the last five years. Comparing Key Metrics As I mentioned, I own SPY . However, I love this class of ETF, so I will not be offended if you choose to buy VOO or IVV instead. I do unequivocally recommend a long position in at least one of these. Key Metrics SPY IVV VOO NAV 208.46 209.72 191.13 Total Assets 175.95 Bil 69.8 Bil 34.33 Bil Average Volume 115.9 Mil 4.1 Mil 1.6 Mil 12-Mo. Yield 1.92% 1.99% 1.96% Expense Ratio 0.09% 0.07% 0.05% Standard Deviation 8.55% 8.56% 8.56% At first glance, SPY is the most expensive choice and offers the lowest 12-Month yield. Additionally, if you reexamine the charts I included above, you will see that VOO outperforms both IVV and SPY in the long term. However, I believe SPY derives additional value from its high liquidity. This liquidity attracts institutional investors which in turn works to lower expense. After extensive research I found that SPY is more cumbersome than IVV and VOO. Each ETF is valuable in its own way which I will soon discuss. Portfolio Composition I wanted to compare each fund’s portfolio composition by sector weighting. I found that VOO, then IVV, and finally SPY (ranked best to worst) held different sector weightings. I created an excel sheet using Morningstar data to compare and contrast each. SPY SPY Portfolio Weightings Sector Weightings % Stocks Benchmark Category Avg. Basic Materials 2.76 2.99 3.26 Consumer Cyclical 11.16 12.04 11.88 Financial Services 15.63 15.21 16.26 Real Estate 2.18 3.26 2 Sensitive Communication Services 3.94 3.73 3.62 Energy 6.91 6.82 7.62 Industrials 10.73 11.31 11.57 Technology 17.9 17.36 17.05 Defensive Consumer Defensive 9.67 8.77 8.87 Healthcare 16.26 15.63 15.59 Utilities 2.87 2.87 2.29 Critics of SPY claim it is clunky and inefficiently weighted. That claim seems overly bombastic, but there is some truth to it. SPY is underweight in: Basic Materials Consumer Cyclical Real Estate Industrials Overweight in: Financial Services Communication Services Energy Technology Consumer Defensive Healthcare Equally Weighted: IVV IVV Portfolio Weightings Sector Weightings % Stocks Benchmark Category Avg. Basic Materials 2.76 2.99 3.26 Consumer Cyclical 11.16 12.04 11.88 Financial Services 15.63 15.21 16.26 Real Estate 2.19 3.26 2 Sensitive Communication Services 3.94 3.73 3.62 Energy 6.92 6.82 7.62 Industrials 10.72 11.31 11.57 Technology 17.9 17.36 17.05 Defensive Consumer Defensive 9.66 8.77 8.87 Healthcare 16.26 15.63 15.59 Utilities 2.88 2.87 2.29 IVV has portfolio allocations identical to SPY. In regards to its benchmark (S&P 500), IVV is: Underweight in: Basic Materials Consumer Cyclical Real Estate Industrials Overweight in: Financial Services Communication Services Energy Technology Consumer Defensive Healthcare Equally Weighted: VOO VOO Portfolio Weightings Sector Weightings % Stocks Benchmark Category Avg. Basic Materials 2.98 2.99 3.26 Consumer Cyclical 11 12.04 11.88 Financial Services 15.15 15.21 16.26 Real Estate 2.11 3.26 2 Sensitive Communication Services 4.02 3.73 3.62 Energy 7.85 6.82 7.62 Industrials 10.91 11.31 11.57 Technology 17.84 17.36 17.05 Defensive Consumer Defensive 9.34 8.77 8.87 Healthcare 15.97 15.63 15.59 Utilities 2.83 2.87 2.2 VOO, in my opinion, has a better allocated portfolio and more attractive weightings. Underweight in: Consumer Cyclical Real Estate Industrials Overweight in: Communication Services Energy Technology Consumer Defensive Healthcare Equally Weighted: Basic Materials Utilities (mostly) Financial Services Investment Strategy Recommendations Whichever ETF you choose, my overall recommendation will remain the same. For this reason I will mention my overall strategy before jumping into an analysis of each ETF. Buy and hold a long position and establish a DRIP ( Dividend Reinvestment Plan ). Try to make monthly contributions to increase the compounding effect over time. Do not worry or hyper focus on short term price fluctuations. It’s difficult (if not impossible) to predict what the market is going to do. In the long term, however, you should expect attractive positive returns. Additionally, you will be able to sleep better knowing you were able to mitigate single stock risk by owning a diversified ETF. SPY SPY is structurally inefficient (compared to its alternatives), but it is cheap, well-covered, and highly liquid. You really can’t go wrong with a long buy and hold position in SPY. I would recommend SPY for beginners and institutional investors. IVV IVV is cheaper than SPY and offers the highest dividend yields (marginally). IVV is also more liquid than VOO. I would recommend IVV for high net worth individuals. VOO VOO is the cheapest and most efficiently weighted option. This Vanguard ETF historically has performed the highest of the three. While, VOO is less liquid than IVV and SPY, it is still adequately liquid. VOO does a better job of tracking the underlying index. VOO is arguably the best choice of the three. I would recommend VOO for those with some investing knowledge looking to graduate from SPY. Why Bother with an S&P 500 ETF? I could talk endlessly on this subject. I’ve already written a little bit about it, but the short answer boils down to this. Seeking alpha is a difficult, risky, and sometimes perilous journey fraught with misunderstanding, bad advice, and cognitive bias . There are a few intelligent individuals out there (and on this site) that have been able to beat the market. For the most part, however, most investors do not beat the S&P 500 . So why not just buy into it? Money managers generally do not beat the S&P 500, and they will charge you a management fee that significantly bites into your returns over time. To illustrate this, let me include one of my favorite graphs. It is easy to fall into the arms of professional money managers because we are intimidated by their financial expertise and “insider knowledge.” Often they will rationalize their exorbitant and predatory fees with backwards logic. Just invest in the index. I promise you’ll be better off. Conclusion Buy and hold a long term position in either SPY, IVV, or VOO. It could be the best investment decision you will ever make. If you don’t want to fruitlessly waste time trying to beat the market; if you don’t want to fall prey to faulty investment advice or get gouged by fees; if you want to manage risk and make money with minimal financial knowledge – invest in the index. I’m really not leading you astray here. I’m not the first person to make this recommendation and I hope I’m not the last. Don’t believe me? Listen to what Warren Buffett has to say. In regards to instructions Buffett laid out in his will, “My advice to the trustee could not be more simple: Put 10% of cash in short-term government bonds and 90% in a very low-cost S&P 500 index fund” Side note: He recommended Vanguard Afterwards : Follow me down the rabbit hole as I cover a variety of Index ETFs (Vanguard or otherwise) to perfect your portfolio. In spite of Buffett’s advice, there is a whole world of high performing, highly diversified, low cost ETFs that deserve some attention. Disclosure: I am/we are long SPY. (More…) I wrote this article myself, and it expresses my own opinions. I am not receiving compensation for it (other than from Seeking Alpha). I have no business relationship with any company whose stock is mentioned in this article.