Tag Archives: nasdaq
Consumer Discretionary And Mid Cap: 2 ETFs To Watch On Outsized Volume
In the last trading session, U.S. stocks fell following solid job gains in July, which has increased the chances of the Fed pulling its trigger on the first rate hike in almost a decade. Among the top ETFs, investors saw the SPDR S&P 500 Trust ETF (NYSEARCA: SPY ) lose 0.2%, the SPDR Dow Jones Industrial Average ETF (NYSEARCA: DIA ) shed 0.2% and the PowerShares QQQ Trust ETF (NASDAQ: QQQ ) move lower by 0.1% on the day. Two more specialized ETFs are worth noting, as both saw trading volume that was far outside of normal. In fact, for the most recent trading session, both these funds experienced volume levels that were more than double their average. This could make these ETFs ones to watch out for in the days ahead to see if this trend of extra interest continues: Vanguard Consumer Discretionary ETF (NYSEARCA: VCR ): Volume 3.18 times average This consumer discretionary ETF was in focus yesterday, as more than 387,000 shares moved hands, compared to an average of roughly 126,000. We also saw some share price movement, as VCR lost 0.1% in the past session. The big move was largely the result of solid July job numbers that indicate stepped-up momentum in the U.S. economy. VCR was up nearly 2.1% in the month, and currently has a Zacks ETF Rank of #2 (Buy). It may an interesting option for longer-term investors. Vanguard Mid Cap ETF (NYSEARCA: VO ): Volume 2.79 times average This mid-cap ETF was under the microscope yesterday, as nearly 776,000 shares moved hands. This compares to an average trading day of 291,000 shares, and came as VO lost nearly 0.1% on the session. The movement can largely be blamed on the growing concerns over interest rates hike and the resultant stronger greenback that can have a huge impact on mid-cap stocks like what we find in this ETF’s portfolio. VO was up nearly 1.2% in the past month, and currently has a Zacks ETF Rank of #3 (Hold). Original Post Share this article with a colleague
Time To Buy Japanese Stocks? Why Not The Yen?
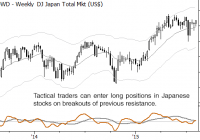
Some trades are obviously simple on the surface: if we think the S&P 500 is going up, we buy the S&P 500. Yes, there are questions to be answered: how much? How do we know we are wrong? Where are we getting out if we’re right? These are important questions, but the essence of the trade is simple – buy the thing we think is going up. Sometimes, though, even the question of what to buy (or sell) – what the appropriate instrument for the trade – can be complicated. A client and friend of mine sent me a note this morning asking about a trade I put on in Japanese stocks. I suggested buying the Nikkei 225 futures (which are not the most liquid market in the world, sometimes) on a breakout, and that US-based investors might want to consider ETF alternatives. His question was… well, rather than paraphrasing, here’s his question: the chart [of the Nikkei average] looks a lot like the USDJPY chart, i.e. strength in Japan seems to be caused by weakness in JPY. Wouldn’t it be less complex to simply use USDJPY? Conceptually the same question arises for set-ups in mining (NASDAQ: RGLD ) or oil stocks etc. Now, I have to basically agree with everything he says there (with the exception of one nitpicking, but critical point). The chart of the Nikkei (below) does, in fact, look a lot like the USDJPY. Here, though, is my point of contention: it’s not quite right to think that strength in Japan is “caused by” weakness in the Yen. One of the best pieces of advice is to be very careful of the phrase “caused by” whenever you are thinking about markets. Do not assume causative links, and check any assumptions carefully. A lot of money has been lost by traders (and made by writers) who oversimplify and assume causative connections that might not be real. A good setup for a long trade on the weekly chart This is not just an academic point; it goes straight to the heart of what we’re trying to do with this trade. I want long exposure to the global equity market that appears to be best set to break out. I want to buy the relative strength leader, ideally before everyone else sees that it’s the leader! That’s what I’m trying to accomplish with this trade, and the most direct way is simply to buy that index. Simple really is better. People tend to over-complicate, particularly in portfolio management, and this can result in complicated trades that don’t do what we expect. For instance, the trader thinking he is “getting gold” by buying something like GDX is getting a mix of gold and stock exposure; he might be disappointed to see GDX go down if gold goes up but stocks go down. These types of complicated trades also carry risks we don’t understand. I’ll write more on this topic of “factor exposure” in portfolio construction and long-term investing, but let me leave you with one last thought about the Japan trade: When we compare global stock indexes, we need to do so with them priced in a common base currency. Because I’m in the US, I look at all stock indexes priced in USD. (Otherwise, we’re looking a combination of currency and stock factors every time we look at a market.) When we execute the trade, we can make a choice to accept the currency risk or hedge it, but we must be aware of the issues and risks involved. This trade provides a good example of the idea of simplicity and the dangers of over complicating. No one would deny that currencies have an impact on stock prices (though we could debate about what, exactly, that impact is), but this is a simple trade. We want long exposure to Japanese stocks with an appropriate risk point. In most cases, we are better off if we don’t get sidetracked by charts that look similar or other potential influences – simply execute the trade in the simplest, most direct way possible.