Tag Archives: nasdaq

Is The Small Cap Stock Premium Disappearing?
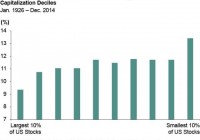
Summary The small cap size premium has shrunk from a 5% annualized return to 1% since Rolf Banz published a landmark paper demonstrating small stocks’ return premium in 1981. The shrinking of the small-cap premium can be explained by several reasons and is not unique in the investment world. A multi-factor investment strategy suggests keeping small-cap stocks, as several factor premiums, including momentum, asset growth and profitability, tend to be stronger among small-cap stocks. Small cap stocks are in a bit of a slump. For example, from January 1, 2014 to July 31, 2015, the Russell 2000 Index of small-company stocks returned just 8.6%, less than half of the 17.4% return of the Russell 1000 Index of large companies. Some market commentators ask whether the small cap premium (the historical phenomenon of small caps tending to outperform large caps) has disappeared; a number of academics even question whether the small cap premium ever existed. For a review of the continuing academic debate on this subject, I invite you to read our recently posted paper, ” Sizing Up the Size Premium .” In this article, I will discuss how we as investment practitioners who construct multi-asset class portfolios think about the small cap premium. The Small Cap Premium First, here’s some history. In 1981, Rolf Banz published a paper on the “small stock effect,” which demonstrated a return premium for small stocks over their larger counterparts.* For instance, from 1961-1980, the size premium earned an annualized return of 5%, which is very attractive. Exhibit 1 below, which divides the market into deciles, illustrates the historical returns from 1926 to 2014 of each market decile. Note the highly significant relationship between firm size and return, where smaller-cap stocks have earned higher returns. (click to enlarge) But since Banz published his paper, a funny thing has happened: the small-cap size premium has shrunk dramatically, from 5% to 1%. In Exhibit 2, which depicts a recent 20-year time period, the smallest decile of stocks is still the best performer, but this chart is much “noisier” than Exhibit 1, which is statistically what one might expect when examining a shorter time period in which data can be more idiosyncratic. Now look at Exhibit 3. Here we see that, during a recent 10-year period, the smallest-cap stocks significantly outperformed only the very largest stocks during the decade. (click to enlarge) (click to enlarge) How do we, as investment managers, explain and address the apparent shrinking of the size premium? I find it fascinating that a nearly identical phenomenon has occurred with value stocks-since Fama and French published their landmark paper on the value premium in 1992, that premium has also shrunk from 5% during the 1972-1991 period of study to just 1%, since 1991. In other words, it seems quite possible that once research on factor premiums (such as size and value) is out there in public, the investment world catches on and whittles away the premium. Since we have tilted portfolios to value and small caps for more than 20 years, I suppose we should plead guilty to aiding and abetting the shrinking premiums! The Case for Small Caps Despite the apparently declining size premium, we do not abandon small cap stocks for a number of reasons. For one thing, we think there is a strong underlying economic argument for why small companies should generate higher returns (though with higher volatility). Small firms do not have the same access to capital as large companies and typically have a higher cost of capital, thus requiring a higher rate of return. When we evaluate investment strategies, we consider economic and financial logic as well as study past patterns of returns. Note, also, that not all small caps are created equal. For instance, over time small-cap value stocks have dramatically outperformed small-cap growth ones (14.86% annualized vs. 8.81% from July 1, 1926 to June 30, 2015, according to Center for Research in Security Prices data), which appears to endorse a tilt to value. In addition, the small-cap growth “style box” has historically been a weak performer, but our research demonstrates that, by stripping out the “growthiest” stocks in this category, an investor will be much happier with returns (see ” Returns on Small Cap Growth Stocks, or Lack Thereof: What Risk Factor Exposures Can Tell Us “). Insights such as these are ones that we employ in building portfolios and, indeed, in constructing our own factor-based investment strategies. To this point, I should add that small cap’s dry spell (recall the 10-year cycle of Exhibit 3) is a good example of why we embrace multi-factor investing rather than single-factor investing (for a quick tutorial on our investing style, see ” What is a Multi-Factor Investment Approach? “). Different factors move in different cycles of different duration, which provides diversification. And importantly, several factor premiums (including momentum, asset growth and profitability) tend to be stronger among small-cap stocks, which is yet another reason why we continue to like investing in smaller companies despite the eroding premium. Conclusion The size premium, while weaker than in the past, is generally still positive. Even with a modest small cap premium, we still believe there is a benefit in holding small cap stocks as a distinct tilt in an equity strategy and as an important component of a multi-factor investment strategy. * Banz, Rolf W. “The Relationship Between Market Value and Return of Common Stocks,” Journal of Financial Economics, November 1981. Disclosure: I/we have no positions in any stocks mentioned, and no plans to initiate any positions within the next 72 hours. (More…) I wrote this article myself, and it expresses my own opinions. I am not receiving compensation for it. I have no business relationship with any company whose stock is mentioned in this article.
Biotech Boom Over? 3 Health Care ETFs To Invest In Instead

The hot and the soaring biotechnology corner of the broad U.S. health care market endured a steep correction last week. In any case the space has long been guilty of overvaluation, with even the Fed chair Yellen pointing to it last year. But investors seemed unaffected as the largest biotech ETF, iShares Nasdaq Biotechnology (NASDAQ: IBB ), added over 22% this year and gained about 50% in the last one-year time frame. However, the bubble had to burst sometime and last week we heard a loud popping noise. IBB was off about 4% and also saw about $522 million in asset outflow last week, per etf.com . Other biotech ETFs also witnessed a sharp sell-off with BioShares Biotechnology Clinical Trials Fund (NASDAQ: BBC ) shedding about 7.5%, Medical Breakthroughs ETF (NYSEARCA: SBIO ) losing 6.2% and SPDR S&P Biotech ETF (NYSEARCA: XBI ) retreating 6%. Though this does not push the biotech space in an outright bear territory, as the area is full of possibilities, investors can take a look at some health care ETFs that bypassed last week’s biotech sell-off. After all, the sector has no dearth of drivers. The merger and acquisition frenzy, encouraging industry fundamentals, promising new drugs, growing demand in emerging markets, ever-increasing health care spending and Obama care play major roles to make it a lucrative bet for the long term. These health care ETFs are all Buy-rated and were in positive territory last week overruling the biotech correction; and they could be on watch in the short term, at least until the penchant for biotech investing returns. Investors should note that apart from the trio, the entire health care space was under pressure last week. PowerShares S&P SmallCap Health Care Portfolio (NASDAQ: PSCH ) This ETF delivered spectacular performance in the broad health care world, returning nearly 24% so far this year and was up 1.14% over the last five trading sessions (as of August 10, 2015). The fund offers concentrated exposure to small-cap health care securities. It holds 73 securities in its basket, with each security holding less than 3.93% share. From an industry perspective, about one-third of the portfolio is allotted toward health care equipment and supplies, followed by health care providers and services (28.3%) and pharmaceuticals (15.7%). The ETF has amassed $253 million in asset and trades in lower volume of about 25,000 shares per day, while charging a relatively low fee of 29 bps a year. The fund has a Zacks ETF Rank #1 (Strong Buy) with a High risk outlook. SPDR S&P Health Care Services ETF (NYSEARCA: XHS ) This product uses the equal weight methodology by tracking the S&P Health Care Services Select Industry Index. Holding 59 stocks in its basket, each security accounts for less than 2.3% of total assets. This is often an overlooked fund with AUM of $205 million and average daily volume of about 20,000 shares. From an industry look, health care services accounts for over one-third of the portfolio while health care facilities, managed health care and health care distributors have considerable allocation. The product charges 35 bps in annual fees. XHS gained about 1% in the last week and returned 18.3% in the year-to-date time frame. It also has a Zacks ETF Rank #1 with a Medium risk outlook. iShares U.S. Healthcare Providers ETF (NYSEARCA: IHF ) This ETF follows the Dow Jones U.S. Select Healthcare Providers Index with exposure to companies that provide health insurance, diagnostics and specialized treatment. In total, the fund holds 51 securities in its basket with major allocations going to United Health and Express Scripts at 12.4% and 7.8%, respectively. Other firms do not hold more than 6.3% of IHF. The fund has been able to manage more than $1 billion in its asset base while volume is moderate at about 84,000 shares per day on average. It charges 43 bps in annual fees and expenses. The Zacks ETF Rank #1 fund added 0.3% in the last week, while it is up over 18% so far this year. Original Post

10%-Yielding HDLV May Be A Good Choice If Interest Rates Remain Low

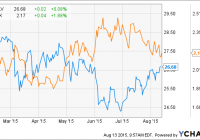
Summary HDLV is filled with blue-chip cash-generating machines. The recent mini-“Taper tantrum” sparked a sell-off in dividend stocks. HDLV is up only 12% from its 52-week lows and may be a good choice if interest rates don’t rise. Introduction In December of 2014, I comprehensively analyzed the methodology and composition of the ETRACS Monthly Pay 2xLeveraged US High Dividend Low Volatility ETN (NYSEARCA: HDLV ), a fund that was only incepted a few months prior. HDLV is a 2x leveraged fund that seeks to hold U.S. companies that possess both a high yield and low volatility. Readers may refer to my previous article for more detailed information on the methodology and composition of this fund. The recent mini-“Taper tantrum” has sparked a sell-off in dividends stocks, particularly those deemed to bond-like. Not surprisingly, this includes many of the top constituents in HDLV, which include blue-chip cash-generating machines such as Verizon Communications (NYSE: VZ ), AT&T (NYSE: T ), Philip Morris (NYSE: PM ), Altria Group (NYSE: MO ) and Duke Energy (NYSE: DUK ). As HDLV is nearly one-year old, this article seeks to provide an update on HDLV to see if it has been able to meet its dual mandate of high dividends and low volatility. Recent performance The graph below shows the price of HDLV and the yield of the 10-year treasury note since February of this year. We can see from the chart that the two lines move in opposite directions, suggesting that the recent price action of HDLV (or rather, its underlying constituents) has been driven by investor fixation on interest rates rather than any material change in the fundamentals of the companies. Interest rates have fallen again over the last two months, allowing HDLV to rise around 12% from its 52-week lows. HDLV data by YCharts How has HDLV performed relative to the broader market? HDLV is a 2X leveraged ETN that tracks twice the monthly performance of the underlying index, which has been considered to be a strategy that reduces the “beta decay” of leveraged securities. Therefore, the performance of HDLV since inception is compared to the UBS ETRACS Monthly Reset 2xLeveraged S&P 500 total Return ETN (NYSEARCA: SPLX ), and the Direxion Monthly NASDAQ-100 Bull 2X Fund (MUTF: DXQLX ), which track twice the monthly return of S&P 500 and NASDAQ-100, respectively. The chart above shows that DXQLX has had by far the best total performance. Although HDLV has recently underperformed, its total return since inception is still slightly higher than that of SPLX. Volatility Has HDLV managed to exhibit lower volatility than the broader market? Unfortunately, as SPLX is not very liquid, its volatility data is distorted by the high bid-ask spreads on the instrument. Therefore, I used the ProShares Ultra S&P 500, a daily-resetting 2X leveraged version of the SPDR S&P 500 Trust ETF ( SPY), instead. The graph below shows the 30-day rolling volatility of HDLV and the ProShares Ultra S&P 500 ETF (NYSEARCA: SSO ) since Nov. 2014. HDLV 30-Day Rolling Volatility data by YCharts The graph above shows that for slightly over half the time, HDLV has had a lower volatility than SSO, suggesting that is has been less volatile than the broader market. This data is corroborated by InvestSpy , which shows HDLV having significantly lower volatility and beta compared to SSO since inception. One area where HDLV appears to underperform SSO is in its maximum drawdown of -14.50% compared to -10.40% for SSO. However, the maximum drawdown figures may not be directly comparable because HDLV resets its leverage monthly whereas SSO resets daily. Ticker Annualized Volatility Beta Daily VaR (99%) Max Drawdown Total return HDLV 21.70% 1.13 3.20% -14.50% 14.60% SSO 25.20% 2 3.70% -10.40% 15.80% SPY 12.60% 1 1.90% -5.30% 9.00% Composition Since my last article in December of 2014, HDLV has undergone three rebalancing events (in January, April and July). The table below shows the top 10 constituents of HDLV in Dec. 2014 and Aug. 2015. Dec. 2014 Aug. 2015 Name Ticker Weighting / % Name Ticker Weighting ConocoPhillips (NYSE: COP ) 10.11 Verizon Communications Inc. VZ 9.89 Verizon Communications Inc. VZ 10.01 AT&T Inc. T 9.55 AT&T Inc. T 9.77 Philip Morris International PM 9.42 Philip Morris International PM 9.20 Altria Group Inc. MO 8.87 Altria Group Inc. MO 7.62 Duke Energy Corp DUK 6.89 Duke Energy Corp DUK 5.84 Southern Co SO 6.18 Southern Co (NYSE: SO ) 5.04 Ventas Inc (NYSE: VTR ) 4.06 Health Care Reit Inc (NYSE: HCN ) 3.90 Health Care Reit Inc HCN 3.70 PPL Corp (NYSE: PPL ) 3.34 Consolidated Edison Inc (NYSE: ED ) 3.68 Entergy Corp. (NYSE: ETR ) 3.11 HCP Inc (NYSE: HCP ) 3.29 Top 10 total 67.94 65.53 We can see that 7 companies, namely VZ, T, PM, MO, DUK, SO and ECN, have remained in the top 10 of constituents of HDLV since 8 months ago. 3 companies have been removed from the top 10 of constituents, including the former top holding COP, as well as PPL and ETR. Meanwhile, VTR, ED and HCP have joined the top 1o constituents of HDLV. Moreover, and as mentioned in my previous article, HDLV is a very top-heavy fund. The top 10 constituents currently account for 65.53% of the total assets of the fund, down slightly from 67.94% in Dec. 2014. As a counterpoint, given that the names in the top 10 are all blue-chip, cash-generating, “widow-and-orphan” stocks, this underdiversification of companies does not unduly worry me. However, what maybe a cause for concern is the underdiversification of sectors . The top 10, or 65.53% of the fund, is entirely concentrated into telecommunications (T, VZ), tobacco companies (PM, MO), utilities (DUK, SO, ED) and healthcare REITs (VTR, HCN and HCP). These sectors are quite interest-rate sensitive, and thus may all decline together when (if?) rates rise, or conversely move up together when rates fall, as has been the case for the past year. Dividends HDLV has paid out 10 dividends since inception, as shown in the chart below. These distributions sum up to $2.12, which based on the current price of $26.64 and annualized to 12 months represents a yield of 9.57% . Risks HDLV charges a management expense ratio of 1.45%, which constituents of a tracking error of 0.85% and a surreptitiously hidden financing spread of 0.60%. This is added to the three-month LIBOR of 0.31% to give a total expense ratio of 1.76%. While this seems high, keep in mind that owning HDLV allows you to effectively control 2X of assets. Therefore, dividing the total expense ratio of 1.76% by 2 gives an effective expense ratio per dollar of assets controlled of 0.88%. If we don’t include the LIBOR in the expense ratio, the effective expense ratio (-LIBOR) is 0.73%. While this is still higher than other popular dividend ETFs such as the iShares Select Dividend ETF (NYSEARCA: DVY ) (0.39%), the SPDR S&P Dividend ETF (NYSEARCA: SDY ) (0.35%) and the Vanguard Dividend Appreciation ETF (NYSEARCA: VIG ) (0.10%), the ability to access cheap leverage may still make this fund more cost-effective for investors than buying on margin themselves. Additionally, and as mentioned above, the constituents of HDLV are quite interest-rate sensitive, and so this fund will likely decline if interest rates spike higher. Finally, as HDLV is an ETN, it is subject to the credit risk of the issuer, in this case UBS. Conclusion I believe that HDLV has been able to meet its dual mandate of high and dividends and low volatility over the past 12 months. Investors who believe that low interest rates are here to stay for longer will be attracted to the blue-chip, income-generating nature of the top constituents of HDLV. The 2X leveraged nature of HDLV has pushed its trailing yield to 9.57% (annualized from 10 months). Moreover, HDLV is currently up only around 12% from its 52-week lows, which may be an attractive entry point for initiating a position. On the other hand, drawbacks of this fund are its overconcentration in companies and sectors, and its sensitivity to interest rates. Readers interested in other high-dividend low-volatility funds may peruse my previous articles on the PowerShares S&P 500 High Dividend Portfolio ETF (NYSEARCA: SPHD ) and the Global X SuperDividend U.S. ETF (NYSEARCA: DIV ). Disclosure: I/we have no positions in any stocks mentioned, but may initiate a long position in HDLV over the next 72 hours. (More…) I wrote this article myself, and it expresses my own opinions. I am not receiving compensation for it (other than from Seeking Alpha). I have no business relationship with any company whose stock is mentioned in this article.