Tag Archives: nasdaq
MORL: Twice The Risk For Not A Lot Of Fun
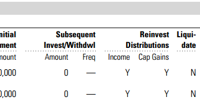
Summary MORL is an exchange traded note offered by UBS benchmarked to 2x the Market Vectors Global Mortgage REITs Index. The Market Vectors® Global Mortgage REITs Index is a float-adjusted, market capitalization weighted index designed to measure the performance of publicly-traded mortgage REITs. The index covers 90% the of mortgage REITs. Even though the MORL currently yields an attractive 26% distribution, it has lost significant value since inception, and last year in particular. When we meet with prospective clients, one of the questions we ask is how they have chosen their existing investments, in particular for their retirement accounts. Quite often, especially with do-it-yourself type investors, we will get two answers that make our ears cringe; 1. choosing the funds that have gained the most in the prior year, and 2. choosing the investments that yield the highest dividend or distribution. For anyone who was looking for distributable yield in the past few years, they have most likely come across many leveraged products, including the UBS ETRACS Monthly Pay 2x Leveraged Mortgage REIT ETN (NYSEARCA: MORL ) which is currently yielding a mind-blowing 26%. Anyone who had invested in this ETN experienced a noticeable disappointment, and absolutely not the under-promise, over-deliver Starbucks (NASDAQ: SBUX ) experience many learned about and love. Let’s dig in. What is the UBS ETRACS Monthly Pay 2x Leveraged Mortgage REIT ETN? MORL is an ETN issued by UBS linked to the monthly compounded 2x leveraged performance of the Market Vectors ® Global Mortgage REITs Index (the “Index”), reduced by the accrued fees. It pays a variable monthly coupon linked to two times the cash distributions, if any, on the index constituents. About the Underlying Index The Market Vectors ® Global Mortgage REITs Index (the “Index”) is a float-adjusted, market capitalization-weighted index designed to measure the performance of publicly traded mortgage REITs. The Index provides 90% coverage of the investable mortgage REIT universe based on strict size and liquidity requirements. The Index is a price return index (i.e., the reinvestment of dividends is not reflected in the Index; rather, any cash distributions on the Index constituents, less any withholding taxes, are reflected in the variable monthly coupon that may be paid to investors of the ETN). The Index was created on August 4, 2011 and has no performance history prior to that date. The UBS ETN was launched on 10/16/2012 with an initial $25.00 per share price. The ETN has an annual expense ratio of .40%. Note: VanEck, the creator of the index also sponsors their own ETF ( Market Vectors Mortgage REIT Income ETF) following this index, trading under the ticker symbol (NYSEARCA: MORT ). It is an ETF that does not employ any leverage. Performance The premise of this product is certainly intriguing, with twice the income of an asset class that is supposed to be safer than typical equities. During times of financial stability, this works out quite well. Unfortunately, mortgage REITs like BDCs and closed-end funds get thrown out with the bathwater during sell-offs and market corrections, without regards that the underlying assets may be sound and stable. Let me explain. The problem with any pooled, daily tradable investment is liquidity. That liquidity is a benefit when you know you are able to redeem your investments any time during market hours. Unfortunately, that very same liquidity and mark-to-market accounting create issues where the underlying assets may be less liquid, such as REITs and BDCs. Liquidity is what creates the need to look at both, the market price, as well as the underlying NAV of the investment. During times of financial instability, the market price per share may be significantly below the actual underlying assets. So how has it performed so far? An issue with looking at investments that have recently launched is that unless the strategy is simply bad, or the active manager is an amateur, it was tough to lose money over the last 5 years in the market. Both MORL and MORT have launched in 2012 and 2011, respectively, so let’s start there to evaluate the performance. I first ran a Morningstar hypothetical test with a $10,000 investment in MORL and MORT, starting at their earliest common date, 10/16/2012, which is the launch date of MORL. As you can see below, if you have reinvested your distributions, a $10,000 MORL investment would be worth approximately $11,624 today. It underperformed the S&P 500 quite a bit, but at least you did not lose money. A $10,000 investment in MORT would be worth approximately $11,498. Wait… a minute. At this point you may be asking yourself… you took twice the risk for a mere $126 incremental return? Yes. Not so fun. (click to enlarge) Ok. What about if you are a typical income investor looking for income to live off of, and did not reinvest any of the distributions? That is what the second illustration is for. (click to enlarge) As you can see, a $10,000 MORL investment would now be worth approximately $6,430 on your statement. A $10,000 MORT investment would be worth a more tolerable $8,444. 2008-like account statements that you would have in 2015. Speaking of 2008, how would this portfolio have performed during that time frame? Unfortunately, none of the marketing materials from VanEck or UBS brings that up. Furthermore, many of the index constituents did not exist prior to 2009. What we do have are 3 mortgage REITs out of the index that do have a trading history. Fortunately, Annaly Capital Management (NYSE: NLY ) that makes up 17% or so of the index has a long trading history, along with MFA Financial (NYSE: MFA ) and Blackstone Mortgage Trust (NYSE: BXMT ). Together, these 3 REITs make up slightly over 25% of the index. You can see the performance of those 3 over the last 10 years below. MFA was the only one able to maintain a positive share price over a 10-year period. NLY is down approximately 32%, and BXMT imploded in 2008 and never recovered netting a 91% loss in share price. (click to enlarge) So how did they do during the peaks of the bear market? Below is a chart from Jan. 1, 2008, through November 1st, 2008: (click to enlarge) NLY suffered a 23% loss, followed by MFA with a 38.8% loss, and finally BXMT with a 72.9% fall in the share price. The thing to keep in mind is that the above are with no leverage. If you were exposed to those companies through the 2x levered UBS note, your losses would be far more severe. Bottom Line Is MORL right for you? Is it really a good product, or merely another idea thrown up in order to generate fees at the expense of foolish investors who are merely looking at yield? For an institution or an experienced professional investor, this article would likely add little that they don’t already know. Those people are also more likely to trade this product, and not invest in it. For a retail investor… listen up. MORL and perhaps even MORT are sophisticated, complex investments that cannot be just bought and forgotten about. They can hurt you very badly, very, very quickly. You must absolutely track them like a hawk with a defined exit strategy in case things go bad. A big thing to keep in mind with MORL is that it is not an exchange traded fund with underlying assets. As with other UBS ETRACS products, it is an exchange traded note, which are unsecured debt obligations of the issuer, in this case UBS AG (NYSE: UBS ). In case of default, your investment is not secured in any underlying mortgage REIT. You would be standing in line with other bondholders with a claim. Besides the zero leverage in MORT, this ETN structure is the other difference between the two products. In case VanEck has issues, your ETF is invested in the underlying mortgage REITs. I do applaud UBS as it clearly makes an attempt to point out that it is a UBS unsecured note and not an ETF on its quarterly fact sheets. The other big warning is… …Don’t Let the 2x Leverage Fool You. In reality, it is far higher. What the marketing material does not go over too well is that the underlying mortgage REITs are already heavily levered. For instance, at the end of Q4 2014, NLY was levered somewhere around 4.8x, and that was a decrease from 2013 when it was more than 6x. What this UBS ETN is doing is applying a 2x leverage multiple to an already levered asset. Remind me again, wasn’t this part of the financial collapse? Is this 2015 or are we reliving 2008 all over again here? Disclosure: I/we have no positions in any stocks mentioned, and no plans to initiate any positions within the next 72 hours. (More…) I wrote this article myself, and it expresses my own opinions. I am not receiving compensation for it (other than from Seeking Alpha). I have no business relationship with any company whose stock is mentioned in this article. Additional disclosure: None of the information discussed should be considered investment advice or a solicitation to buy or sell any securities. Please consult your investment advisor for specific recommendations.
VDADX: A Great Mutual Fund That Is Remarkably Low On 2 Key Sectors
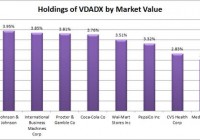
Summary VDADX offers investors a great start to building a dividend portfolio. The fund is missing almost all exposure to the utility sector and to oil and gas. The expense ratio is exceptionally low, and the historical volatility has been better than that of the market. Investors should be seeking to improve their risk-adjusted returns. I’m a big fan of using ETFs to achieve the risk-adjusted returns relative to the portfolios that a normal investor can generate for themselves after trading costs. Despite my frequent use of ETFs in my personal investing, many retirement accounts still use mutual funds as a major source of their investing. When it comes to assessing the mutual funds, one of my earlier favorites is the Vanguard Dividend Appreciation Index Fund (MUTF: VDADX ). Largest Holdings I’m starting the analysis by looking at the largest holdings in VDADX. As you can guess from the name, there is a heavy emphasis on receiving dividends from the portfolio. (click to enlarge) The holdings are a little on the heavily concentrated side with several holdings over 3%, and it is interesting that the fund opted to include heavyweights on both Coke (NYSE: KO ) and Pepsi (NYSE: PEP ). However, I don’t see any real disadvantage to holding both for better diversification since the investor won’t be stuck paying trading costs to buy each individually. The thing that really stands out to me is that there is no Exxon Mobil (NYSE: XOM ) or Chevron Corporation (NYSE: CVX ) in the top 10. XOM is yielding over 3.5% and CVX is up near 5%. That really concerns me. Though I did not chart the rest of the top 100 holdings, I did scan through them looking for Exxon or Chevron. Neither was included anywhere in the top 100 holdings. Granted oil prices are plummeting and oil stocks may seem “risky”, but a small inclusion would be entirely appropriate for a portfolio focused on dividends. The yields are high, and the companies would benefit from higher gas prices while many parts of the economy would be disadvantaged by high fuel prices. For diversification purposes, it is very strange not to have them included. On the other hand, Vanguard is including quite a few other holdings that I wouldn’t put at the top of the list for a fund focused on dividends. For instance, Costco (NASDAQ: COST ) is included in the portfolio despite having a yield of only 1.09%. There is nothing wrong with Costco as a company from my perspective, but the portfolio already has quite a bit of retail exposure and is lacking in the big gas companies. Diversification Benefits The correlation to SPY is just under 97%, so diversification benefits are not very substantial. However, the volatility on the fund is materially lower at only 87% of the level on SPY, which is nice for investors who would prefer more stability in their portfolio values. Yield & Taxes The SEC yield is 2.19%. Again, this feels fairly low for a dividend portfolio and brings me back to the question of why companies like Chevron were not given a prominent weighting in the portfolio. Expense Ratio The mutual fund is posting an expense ratio of .10%. I want diversification, I want stability, and I don’t want to pay for them. An expense ratio of .10% is absolutely beautiful and makes VDADX a solid choice for investors. Sector Allocations To go a little deeper into the absence of the major oil companies I like to see included in a dividend growth portfolio, I grabbed a chart of the sector allocations. (click to enlarge) As you can see, the oil and gas sector was only 1.3% for the fund. That matches the index that the fund is tracking; however, I find it interesting that the index was designed to limit the exposure to oil and gas. If I were establishing a dividend index for a fund that could be used as a major portion of an investor’s portfolio, I would want to increase the oil and gas weightings to around 10%. The other interesting factor is that utilities are also mostly absent. Unless the investors are buying utility companies themselves, the ideal allocation, in my opinion, would include a higher weighting for utilities in the 10% to 15% range. Conclusion For investors looking at the very long-term picture, the extremely low expense ratio is beautiful. Vanguard has been one of the best in the business at creating low-fee mutual funds. I don’t think a fund should be chosen purely for the expense ratio, but I do believe investors should be very aware of it. When I’m putting together hypothetical portfolio positions, one of the things I include is the expense ratio on the individual positions to track the overall expense ratio on the portfolio. The overall portfolio looks solid with the exception that oil and gas is largely absent and the utility sector is strangely underrepresented despite several utility companies having strong yields. If I were using VDADX as a core holding in my retirement accounts, I would want to complement it with specifically increasing allocations to large-cap oil and gas companies and a geographically diversified group of utility companies. Disclosure: I/we have no positions in any stocks mentioned, and no plans to initiate any positions within the next 72 hours. (More…) I wrote this article myself, and it expresses my own opinions. I am not receiving compensation for it (other than from Seeking Alpha). I have no business relationship with any company whose stock is mentioned in this article. Additional disclosure: Information in this article represents the opinion of the analyst. All statements are represented as opinions, rather than facts, and should not be construed as advice to buy or sell a security. Ratings of “outperform” and “underperform” reflect the analyst’s estimation of a divergence between the market value for a security and the price that would be appropriate given the potential for risks and returns relative to other securities. The analyst does not know your particular objectives for returns or constraints upon investing. All investors are encouraged to do their own research before making any investment decision. Information is regularly obtained from Yahoo Finance, Google Finance, and SEC Database. If Yahoo, Google, or the SEC database contained faulty or old information it could be incorporated into my analysis.